Operations | Monitoring | ITSM | DevOps | Cloud
Logging
The latest News and Information on Log Management, Log Analytics and related technologies.
Stretch Your Reach with Unified JFrog Data and Elastic
With 'Back to School' Planning Upon Us, It's All About the Data
It’s a mystery why the film community felt an iconic movie like “Grease” needed a reprise. But alas, “Grease 2” hit the big screen and ushered in new teen angst themes around bowling and the talent show.
Micro Lesson: Partitions Basics
Improving Application Quality through Log Analysis
Importance of System Resource Monitoring on Graylog, Elasticsearch, and MongoDB Servers
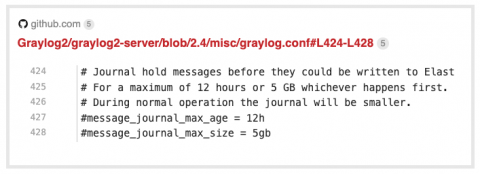
The first thing we tell Graylog users is, “Monitor your disk space.” The core set of metrics discussed below should always be in acceptable parameters and never grow over extended periods without going back to normal levels. This is why it is critical to monitor metrics that come directly from the hosts running your Graylog infrastructure.
New on Elastic Cloud: Self-service subscriptions, in-place configuration changes
We’re pleased to introduce you to the latest Elastic Cloud features and functionality. Grab a cup of your favorite beverage and five minutes, and let’s dive in.
Integrating Attack Behavior Intelligence into Logstash Plugins
DevOps Toolchain Explained: What Is & How to Create One. Choosing Between Buying or Building Your Own Tools
Over the past few years, we’ve seen an almost obsession with developing and adopting CI/CD tools throughout the DevOps community. There are thousands of “how-to’s”, “top x tools”, and “tool x vs tool y” type articles, and it has gotten to the point where it’s quite difficult to figure out how and which one to pick as your own.
Monitoring Zoom Metrics from Your Machine with Logz.io
Like everyone else, my life for the last few months has become a never-ending stream of video calls. With Zoom calls, and the occasional Skype, Google Meet, or Microsoft Teams, becoming the norm I’ve noticed that the fans on my Macbook have been kicking in and sounding like a tiny jet trying to take off.


