Operations | Monitoring | ITSM | DevOps | Cloud

The latest News and Information on Monitoring for Websites, Applications, APIs, Infrastructure, and other technologies.

Save up to 14 percent CPU with continuous profile-guided optimization for Go

We are excited to release our tooling for continuous profile-guided optimization (PGO) for Go. You can now reduce the CPU usage of your Go services by up to 14 percent by adding the following one line before the go build step in your CI pipeline: You will also need to supply a DD_API_KEY and a DD_APP_KEY in your environment. Please check our documentation for more details on setting this up securely.

Launching Resource Performance Monitoring

What is the slowest part of your website? Most of the time, it’s the resources: all the CSS, fonts, images, and JavaScript that powers your webpage. Resources that are too big or too slow are often the root cause of slow Core Web Vitals. This week, we’re releasing a bunch of new tools and reports to better understand your web resources, how they impact your website performance, and where you have opportunities to improve.

Datadog vs Grafana: Comparison Guide 2024

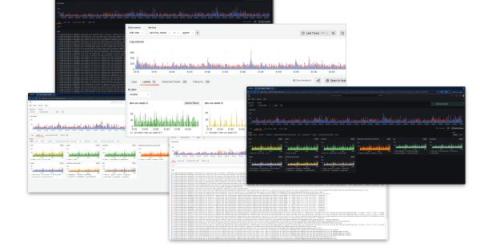
Monitoring tools are essential for maintaining stability and performance. They enable organizations to monitor diverse metrics, analyze trends, and identify anomalies to prevent downtime and maximize resource efficiency. Among the leading solutions in this domain, both Datadog and Grafana are recognized for their effectiveness and versatility. Understanding the nuances between these platforms is vital for businesses to make informed decisions about which tool best suits their needs.

Grafana Enterprise data source plugins: A brief guide to what they are and how to get started

One of the most powerful features of Grafana is the ability to unify and derive value from your data, regardless of where that data lives. This is because we’re fully committed to making Grafana an open, composable, and extensible observability platform for our more than 20 million users worldwide. But how exactly do we deliver on that promise of openness and extensibility? Grafana data source plugins play a big role.

Server Administrator's Guide to POP3 and IMAP Monitoring

Over 347 billion emails were sent and received every day in 2023, a number that is expected to increase to over 361 billion daily emails in 2024. With so much information always flowing, the reliability and efficiency of email servers have never been more important. So what happens when servers fail and emails don’t go through? Consider the financial repercussions — downtime can cost businesses as much as $5,600 per minute (a whopping $300,000 per hour).

Navigating the Maze of Incumbent Pricing Models in IT and Security

This is the second in a series of blog posts about the disconnect between modern IT and security teams and the vendors they’re forced to work with. If you’re looking for the first and last posts, you can find it here. In the dynamic world of managing observability and telemetry data, pricing models for tools and platforms are showing their age, creating a significant disconnect between vendors and the IT and security teams they serve.

Introducing the Elastic distribution of the OpenTelemetry Java Agent

As Elastic continues its commitment to OpenTelemetry (OTel), we are excited to announce the Elastic distribution of the OTel Java Agent. In this blog post, we will explore the rationale behind our unique distribution, detailing the powerful additional features it brings to the table. We will provide an overview of how these enhancements can be utilized with our distribution, the standard OTel SDK, or the vanilla OTel Java agent.

Best Practices for Operating and Monitoring an SD-WAN Network

SD-WAN has emerged as a game-changer for organizations seeking to optimize network performance and enhance connectivity across geographically dispersed locations. However, you need effective operational and monitoring practices to get the full benefit of SD-WAN. This becomes increasingly important due to the operational and security challenges that arise as SaaS applications become more popular and end users can work from anywhere.

How MSPs Can Maximize Network Observability: 3 Keys to Success

In today’s increasingly dynamic digital world, the need for end-to-end network visibility has never been more critical. These requirements are especially profound for managed service providers (MSPs) and communications service providers (CSPs). MSPs and CSPs find themselves at the epicenter of digital transformation.

Deploy The ELK Stack on Kubernetes with Helm

The main objective of the ELK (Elasticsearch, Logstash, and Kibana) is to aggregate logs. However, with the increased usage of ELK and Kubernetes as a pairing the solution can go beyond the aggregation of standard logs and include monitoring and analysis of Kubernetes telemetry data. Therefore, more users are looking at deploying the ELK stack on Kubernetes. Yet, deploying the ELK stack on Kubernetes can be a complex task but with the assistance of Helm charts, the process is much simpler.