Operations | Monitoring | ITSM | DevOps | Cloud

The latest News and Information on Monitoring for Websites, Applications, APIs, Infrastructure, and other technologies.

Your IT Alerting Software is Failing You. We Can Help.

Sometimes an IT ticket is just an IT ticket. But far more often, when one or a few tickets are submitted, it means there are many more users and systems exposed to the same issue. IT issues can quickly get out of control and affect many employees, sometimes overnight. When these get out of control, they can become “top call drivers” that bring your team, department, business lines, and even entire business to a halt.
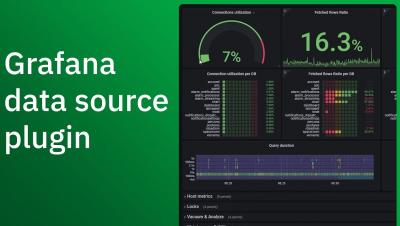
How to autoscale Grafana Loki queries using KEDA

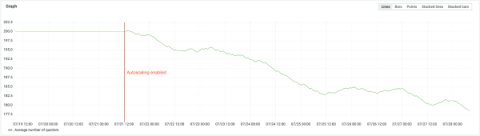
Grafana Loki is Grafana Labs’ open source log aggregation system inspired by Prometheus. Loki is horizontally scalable, highly available, and multi-tenant. In addition, Grafana Cloud Logs is our fully managed, lightweight, and cost-effective log aggregation system based on Grafana Loki, with free and paid options for individuals, teams, and large enterprises.

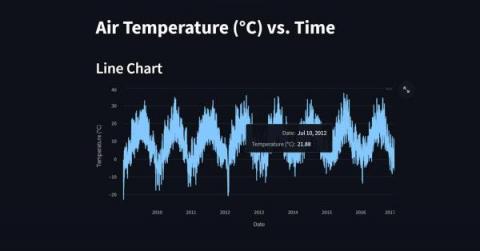
How to manage high cardinality metrics in Prometheus and Kubernetes

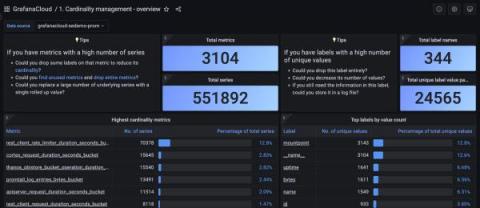
Over the last few months, a common and recurring theme in our conversations with users has been about managing observability costs, which is increasing at a rate faster than the footprint of the applications and infrastructure being monitored. As enterprises lean into cloud native architectures and the popularity of Prometheus continues to grow, it is not surprising that metrics cardinality (a cartesian combination of metrics and labels) also grows.

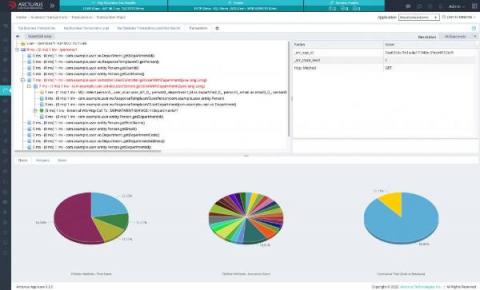
How to monitor Microservices?

Microservices are being used every where and for good reasons. They do provide you with many benefits especially improved focus and cutting the time to market. Microservices do bring complexities too. Monitoring microservices is complex because of simply the number of them. Monitoring a user transaction requires monitoring many microservices. Correlating the data from them to identify the root cause manually is a nightmare especially in a complex environment with 100s or 1000s of microservices.

ScienceLogic Achieves Record Q3, Meeting Strong Demand for IT Transformation

I am thrilled to announce that ScienceLogic posted its best quarterly sales bookings in our company’s history! Amid warnings from the broader tech industry slowdown, ScienceLogic proved once again to be an outlier, as current macro trends continue to drive strong demand for IT transformation.

Bringing "Blameless" to Traffic Court | J. Paul Reed (Release Engineering Approaches)

What do modern incident analysis techniques and moving violations have in common? This Quick Bite tells the story of taking the same retrospective techniques the most innovative technology companies in the world use to understand their operational incidents... to traffic court, to help us all understand what really happened? What happened next? Come find out!

When Cloud Native Stacks Misbehave - Pitfalls and Lessons Learned | Itiel Shwartz (Komodor)

In this session, Itiel Shwartz will demonstrate common failure scenarios - both app and infra related. We will laugh a little and cry a little, and then cover monitoring, observability & troubleshooting best practices methodologies such as metrics, distributed tracing, logging, network visualization and more. But cheer up! We’ll wrap up by introducing some helpful tools, in order to find and fix issues as fast as possible.