Operations | Monitoring | ITSM | DevOps | Cloud

The latest News and Information on Monitoring for Websites, Applications, APIs, Infrastructure, and other technologies.

Understanding Domain-Agnostic v. Domain-Centric AIOps Platforms

No matter what we do, we’ll always be surrounded by choices. Do I save money and take the bus, or do I spend money filling up my gas tank? Do I make dinner at home, or do I eat dinner out? Whatever the outcome, it’s our needs – what we require and what we can afford – that help guide us to where we should go. Technology is no exception. Especially in AIOps.

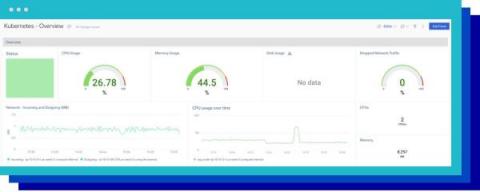
What's new in Sysdig - September 2022

Welcome to the September edition of What’s New in Sysdig in 2022! I’m Ayu Shah, Principal Sales Engineer based out of San Francisco Bay Area. I joined Sysdig a little over six months ago and it has been an exciting journey to say the least! I have worn many hats in my career, from Software Engineering to Sales and everything in between. I am excited to share some updates to What’s New in Sysdig for this month!

Key Observability Scaling Requirements for Your Next Game Launch: Part III

So far in our series on scaling observability for game launches, we’ve discussed ways to 1) quickly analyze large volumes of telemetry data and, 2) ensure high-quality telemetry data for more effective analysis at lower costs. The best practices in these blogs outline best practices for scaling observability during game launch day – which is necessary to ensure high performance across all infrastructure components – to ensure no lag, no glitches, and no bugs.

Network Log Archiving = Perfect Backwards Visibility

Network monitoring is ideal for getting a real-time view of your connected environment, and with reports, you can look back in time too. Logs are key to this rear-view mirror look, as they contain all the data for all the elements you are monitoring. But without network log archiving, you can only look back so far. Did you know that according to an IBM/Ponemon study, it takes an average of 287 days to discover and contain a data breach?

How I monitor cloud application costs in one simple but powerful dashboard

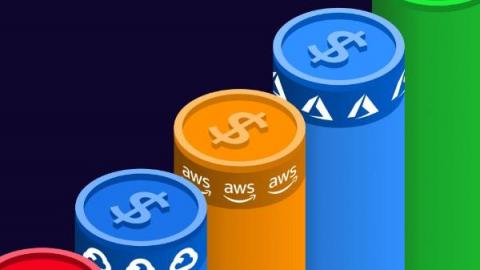
Although there are many great tools out there to get on top of application monitoring, there’s one vital metric that’s often overlooked by us technical folks – cost. In the days of running apps on servers in private datacenters, the kit was a one-time purchase that the systems team had to deal with. But running apps in public clouds is a different story. Whether you’re running on VMs, containers in Kubernetes, or entirely serverless, execution of your code adds to the bill.

Code-level Application Monitoring for Every Developer

The monitoring, tooling, and observability space is crowded. It’s hard to keep track of what most tools in this category originally set out to do— but if we had to guess… they were probably built to support monolithic architectures with complex systems, to give Ops and IT a way to minimize the impact of an outage.

Inside the migration from Consul to memberlist at Grafana Labs

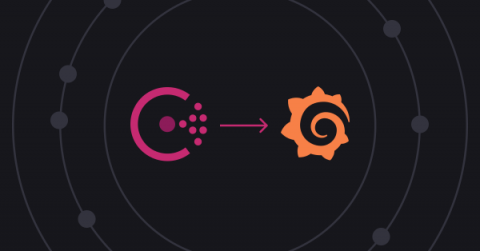
At Grafana Labs we run a lot of distributed databases. These distributed databases all make use of a hash ring in order to evenly distribute workloads across replicas of certain components. For a more detailed description of the architecture of our projects, check out our Mimir architecture docs.

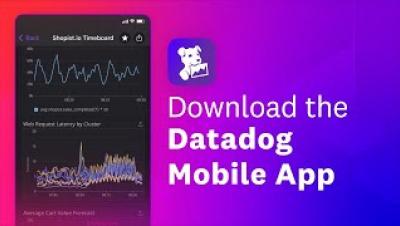
Investigate critical alerts on the go with the Datadog mobile app

The Datadog mobile app provides real-time visibility into critical alerts, incidents, and application performance metrics across your entire environment, helping you troubleshoot directly from your mobile device. On-call engineers can quickly evaluate the conditions that triggered an alert, determine its urgency, and decide the next course of action—anywhere, anytime.