The latest News and Information on Monitoring for Websites, Applications, APIs, Infrastructure, and other technologies.
In the Kubernetes (K8s) community, there is a huge misconception about CPU allocation and utilization. Even highly experienced SREs find themselves struggling with the way Kubernetes allocates CPU resources, leading to misconfigured CPU allocations and extremely negative outcomes. For starters, this results in significant quality degradation on important service components, introduced by behind-the-scenes CPU limiting (or throttling).
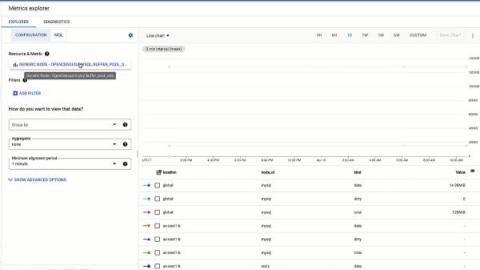
Monitoring is a fundamental pillar of modern software development. With the advent of modern software architectures like microservices, the demand for high-performance monitoring and alerting shifted from useful to mandatory. Combine this with an average outage cost of $5,600 per minute, and you’ve got a compelling case for investing in your monitoring capability.
It is so important that every aspect of the web is accessible to all, and if – like me – you work in digital, then it is our responsibility that we make that happen.
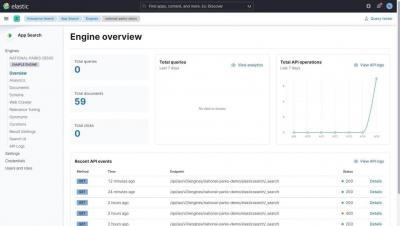
Elastic Enterprise Search 8.2 introduces new ways to ingest, search, and monitor data, giving developers the productivity benefits of using out-of-the-box capabilities along with the power and flexibility inherent in Elastic Stack tools. Operators also gain even more transparency for managing search experiences and observing search performance. For a visual walkthrough of some of the key capabilities in 8.2, check out the latest installment of What’s new in Enterprise Search on YouTube.
As more organizations adopt cloud-native technologies and microservices-based architectures, application troubleshooting is becoming increasingly complex. With so many moving parts in an environment that is both dynamic and distributed, it is difficult to get the full picture. Yet complete visibility is crucial in order to find and fix issues quickly — especially ones that impact the bottom line.