Operations | Monitoring | ITSM | DevOps | Cloud

Monitoring

The latest News and Information on Monitoring for Websites, Applications, APIs, Infrastructure, and other technologies.

Domain Driven Design For All

Domain Driven Design (DDD) is usually associated with microservice architectures. As microservice architectures have been perceived as burdensome and overly complex, so too have organizations started to call into question the relevance of DDD initiatives. The argument is usually that unless an organization reaches a mega-scale that requires eventing to keep and micro-services to scale horizontally, such architectures are overkill.

Cribl Stream Projects

The increasing demand for Cribl Stream as an internal service is a testament to its effectiveness in improving operations and enhancing security measures. With the rise of ITOps, SecOps, SRE, DevOps, and other teams embracing Cribl Stream, we are excited to offer Cribl Stream Projects, which enables the secure expansion of Stream usage to more users within organizations. This enhances collaboration and provides deeper insights, resulting in a more personalized user experience. With Stream Projects, Cribl is the first product in the industry enabling organizations to allow teams to manage their own data without needing to understand the infrastructure or service being used to collect and route it.

Four reasons to try our next-gen dashboards

When you need to troubleshoot faster, rich out-of-the-box content lets you easily monitor the tools in your technology stack. Dashboards are key to our customers’ success — offering you deep insights at a glance and the ability to drill into the details most important to you. A couple years ago, we debuted a new style of dashboards, built on top of a scalable, flexible and extensible charting system.

Monitoring to Ensure Optimal Developer Experience and Productivity

For Software Houses, developers are as important as customers are to a retail organization – if the Developer Experience (DX / DevExp / DevEx) is poor, then work simply will not get done effectively and the best and the brightest are likely to leave for an employer who offers a better experience and hence, more productivity and job satisfaction. Long-term frustrated employees and staff attrition tend to impact product quality and lead to weaker software applications.

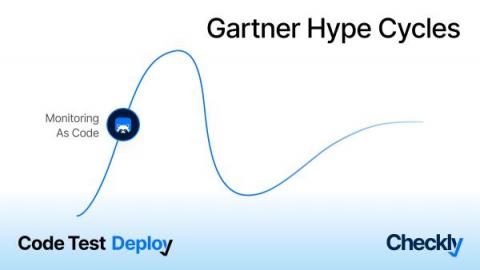
Exciting Times for Monitoring as Code: A Nod from TWO Gartner Hype Cycles

Earlier this week we shared some exciting news. Checkly has made its mark in not one, but two Gartner Hype Cycles reports. We're being recognized for something we're super passionate about - Monitoring as Code (MaC). This recognition comes in the Hype Cycle for Monitoring and Observability and the first ever Hype Cycle for Site Reliability Engineering. It's a big deal for us, and here's why it should matter to you, too.

Navigating the Serverless Landscape: Lessons from our Tracing Collector API Journey

In the previous blog in this series, we delved into the redesigned architecture of Amazon Prime Video and how they integrated different architectural styles for optimal performance and cost efficiency. We also discussed the impact of Amazon’s decision on the concept of a “serverless-first” mindset, highlighting the importance of considering alternative architectural approaches based on specific use cases and requirements.

Getting Started with GROK Patterns

If you’re new to logging, you might be tempted to collect all the data you possibly can. More information means more insights; at least, those NBC “the more you know” public services announcements told you it would help. Unfortunately, you can create new problems if you do too much logging. To streamline your log collection, you can apply some filtering of messages directly from the log source. However, to parse the data, you may need to use a Grok pattern.

OpenTelemetry demo app with Grafana, Loki, Prometheus, Tempo (Grafana Office Hours #06)

DevOps Engineer Blueswen Li 劉義瑋 joins us to walk us through some OpenTelemetry demo apps he created, instrumented with Grafana, Loki, Prometheus, and Tempo. He is joined by two of our Developer Advocates, Paul Balogh and Nicole van der Hoeven.

Harnessing Distributed Tracing for Application Performance Optimization

Distributed tracing is a powerful technique that allows you to track the flow and timing of requests as they navigate through a system. By linking operations and requests between multiple services, distributed tracing provides valuable insights into system performance and helps identify bottlenecks. In this blog post, we will delve into the benefits of distributed tracing, explore its relevance for various application architectures, and uncover how it operates behind the scenes.

Best Practices for Monitoring Kubernetes with Grafana

There are tons of tools to choose from when it comes to visualizing data, but Grafana has become one of the best ways for organizations to visualize information and get notified about events happening within their infrastructure or data. According to Kubernetes: In this article, we will take a look at the best practices for monitoring Kubernetes using Grafana.