Operations | Monitoring | ITSM | DevOps | Cloud
Monitoring
The latest News and Information on Monitoring for Websites, Applications, APIs, Infrastructure, and other technologies.
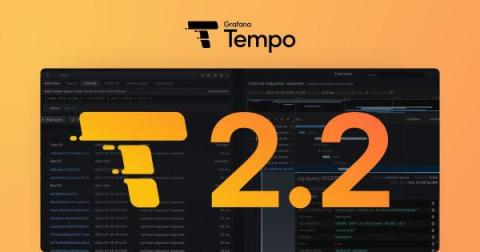
Grafana Tempo 2.2 release: TraceQL structural operators are here!
Get excited about Grafana Tempo 2.2! Not only is this release on time, but it is also chock full of TraceQL features and performance improvements. I was honestly a little shocked by how much we have accomplished in the last three months when summarizing the changelog.
Mapping hostnames to locations with Icinga Director
Recently I came across the Maps module build and maintained by our community. The module displays host objects and annotations on openstreetmap using the JavaScript library leaflet.js. The module reads the coordinates for each host from custom variables and is able to group multiple hosts on the same location. There is already a guide on our blog that describes how you can use the module with human readable locations instead of numeric geolocations.
Using Grafana and Graphite to monitor server load
Since server outages can lead to a loss of customers, reputation, and other troubles and it is important to get information on the status of the server on time. MetricFire's Hosted Grafana and Graphite will help you monitor server load in a timely and efficient manner. Servers generate a large number of metrics and it is essential to not only track their values but also to observe their changes over time. There is also a possibility to correlate app statistics with server load metrics.
How to Tackle Spiraling Observability Costs
As today’s businesses increasingly rely on their digital services to drive revenue, the tolerance for software bugs, slow web experiences, crashed apps, and other digital service interruptions is next to zero. Developers and engineers bear the immense burden of quickly resolving production issues before they impact customer experience.
Optimize Equipment with Data-Driven Analytics
We want machines in good working order, making products of superior quality. This isn’t news. But what is newsworthy is that routine maintenance can still lead to more downtime than necessary. Not all maintenance programs are created equally. Keeping capital equipment running doesn’t exist inside a vacuum of chance. Outside the fraction of unavoidable catastrophes, there’s much power in the decision-making process.
Golang Monitoring using OpenTelemetry
Crafting Prompt Sandwiches for Generative AI
Large Language Models (LLMs) can give notoriously inconsistent responses when asked the same question multiple times. For example, if you ask for help writing an Elasticsearch query, sometimes the generated query may be wrapped by an API call, even though we didn’t ask for it. This sometimes subtle, other times dramatic variability adds complexity when integrating generative AI into analyst workflows that expect specifically-formatted responses, like queries.


