Operations | Monitoring | ITSM | DevOps | Cloud

RUM

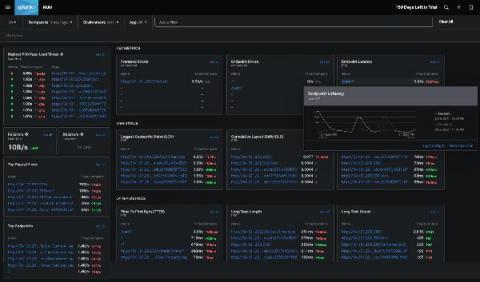
Real User Monitoring: Past, Present and Future

Most front-end developers and practitioners are familiar with real user monitoring (RUM) tools as a means to understand how end-users are perceiving the performance of applications. Few people, however, are aware of the history of the RUM market, going back more than two decades. Over the years, as the internet has evolved with new technologies, RUM tools have evolved in lock-step to cater to the ever changing needs and use cases of engineering teams.

Sponsored Post

Real User Monitoring for Microsoft 365 and SaaS Performance Issues

Service Watch for Real User Monitoring (RUM) has come a long way. Our last product update announcement talked about new layouts for Service Watch Browser (SWB) and Service Watch Desktop (SWD). These new layouts and widgets provide IT with a holistic end-user experience score. If we try to use business-critical application services from home (or call it #WorkAnyWhere), the experience is often not the same as working from corporate headquarters. Service Watch closes this gap with its browser and desktop passive monitoring solution, enabling IT to collect 1000's of advanced metrics for accelerating troubleshooting.

What is Real User Monitoring?

Choosing the appropriate tools and approaches to utilize for application performance management can quickly become confusing. That's why it's important to remember that the ultimate goal of monitoring is to figure out two things: And there may be no better beginning point than incorporating real-user monitoring (RUM) using a performance monitoring solution to get as close as feasible to meet both objectives.

Combine Synthetics and Real User Monitoring for a Complete End-User Digital Experience

Real User Monitoring (RUM) is becoming increasingly popular during the pandemic as most employees start to work remotely from home. This type of passive monitoring approach captures the real end-user experience of accessing web applications. IT gathers SaaS application performance metric data and leverages those insights to quickly troubleshoot issues for remote workers. On the other hand, Synthetic monitoring emulates real users accessing cloud and infrastructure services like Microsoft 365. Businesses would benefit from a holistic monitoring strategy that includes both RUM and Synthetic tests to cater to the needs of a hybrid remote workforce.

How to Ensure Superior End-User Digital Experience in the Age of Work from Anywhere

Digital Experience Monitoring is becoming the norm as the pandemic forces employees to work remotely. Enterprises need to ensure a great end-user digital experience using techniques like Synthetics and Real User Monitoring (RUM). Let Microsoft 365 performance issues not hold you back to transition to a digital remote work future.

New Splunk Synthetic Monitoring Features Help Integrate Uptime and Performance Across the Entire Splunk Platform

For teams that build or maintain modern applications with their end-users in mind, the acquisition of Rigor means that Splunk now offers the most comprehensive synthetic monitoring solution on the market. Rigor, now Splunk Synthetic Monitoring and Web Optimization, provides best-in-class synthetic monitoring capabilities enabling IT Ops and engineering teams to detect and respond to uptime and performance issues within incident response coordination and throughout software development lifecycles.

Comparing Real User Monitoring and Synthetic Transactions

Written by Nick Cavalancia, Microsoft Cloud & Datacenter MVP The need for visibility into service availability and delivery quality has led to the rise in interest in monitoring Microsoft’s Office 365 services from the user perspective. With two different approaches available, what value do they each bring?

How to Find Memory Leaks in Websites and Web Applications

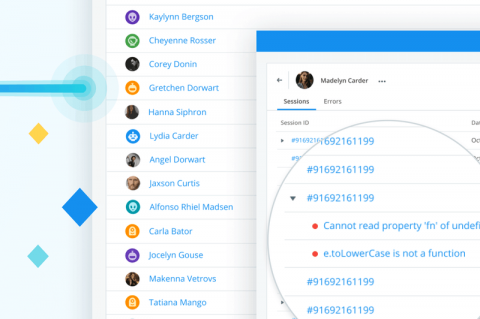
Knowing how your users interact with your web application and how they experience it is crucial to provide the best possible experience. So what do you need to know? Start with metrics such as page load times, HTTP request times, and core Web Vitals – time to the first byte, first contentful paint. If you use Sematext Experience you’ll see a number of other useful metrics for your web applications and websites there. However, metrics themselves are only a part of the whole picture.