Operations | Monitoring | ITSM | DevOps | Cloud

Monitoring

The latest News and Information on Monitoring for Websites, Applications, APIs, Infrastructure, and other technologies.

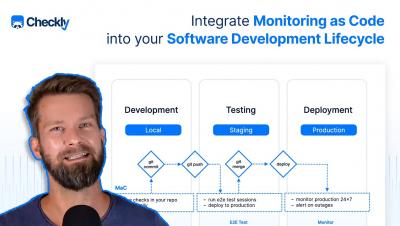
Integrate Monitoring as Code into your Software Development Lifecycle

Learn how the new Checkly features (code exporter and activity log) enable you to integrate Monitoring as Code into your Software Development Lifecycle. Define and debug your monitoring resources during development, test your preview deployments and start monitoring productions with ease.

InfluxDB 3.0 is up to 45x Faster for Recent Data Compared to InfluxDB Open Source

With the release of InfluxDB 3.0, one of the big questions is: how does it compare to previous versions of InfluxDB? We have begun benchmarking InfluxDB 3.0 with production workloads to start giving users more insight into the benefits of adopting InfluxDB 3.0. In this post, we look at recent benchmarks comparing InfluxDB 3.0 to InfluxDB Open Source (OSS) 1.8.

From Solution to Startup

Before Datadog was a widely adopted SaaS platform, it was a tool developed to solve our founders’ own monitoring needs. As technology-oriented people, we often build solutions for our own problems, then discover those problems are widespread. But how do you know when your solution should be something more? In this panel session, we’ll talk with tech startup founders to hear their stories and advice for turning tools into businesses.

ML-Powered Assistance for Adaptive Thresholding in ITSI

Adaptive thresholding in Splunk IT Service Intelligence (ITSI) is a useful capability for key performance indicator (KPI) monitoring. It allows thresholds to be updated at a regular interval depending on how the values of KPIs change over time. Adaptive thresholding has many parameters through which users can customize its behavior, including time policies, algorithms and thresholds.

Monitoring as Code in Your Software Development Lifecycle

When we launched the Checkly CLI and Test Sessions last May, I wrote about the three pillars of monitoring as code. Code — write your monitoring checks as code and store them in version control. Test — test your checks against our global infrastructure and record test sessions. Deploy — deploy your checks from your local machine or CI to run them as monitors.

How to monitor CoreDNS with Datadog

In Part 1 of this series, we introduced you to the key metrics you should be monitoring to ensure that you get optimal performance from CoreDNS running in your Kubernetes clusters. In Part 2, we showed you some tools you can use to monitor CoreDNS. In this post, we’ll show you how you can use Datadog to monitor metrics, logs, and traces from CoreDNS alongside telemetry from the rest of your cluster, including the infrastructure it runs on.

ITOps vs. DevOps: what's the difference?

Titles within an organization evolve nearly as fast as the technology itself. For a long time, the title of DevOps was considered a literal interpretation of “Development” and “Operations” – a catch-all term for hybrid roles encapsulating everything from on-prem, cloud, and hybrid infrastructures, to code execution and lifecycle management. Sounds like a lot? It is.

Tools for collecting metrics and logs from CoreDNS

In Part 1 of this series, we looked at key metrics you should monitor to understand the performance of your CoreDNS servers. In this post, we’ll show you how to collect and visualize these metrics. We’ll also explore how CoreDNS logging works and show you how to collect CoreDNS logs to get even deeper visibility into your Deployment.