Operations | Monitoring | ITSM | DevOps | Cloud

Monitoring

The latest News and Information on Monitoring for Websites, Applications, APIs, Infrastructure, and other technologies.

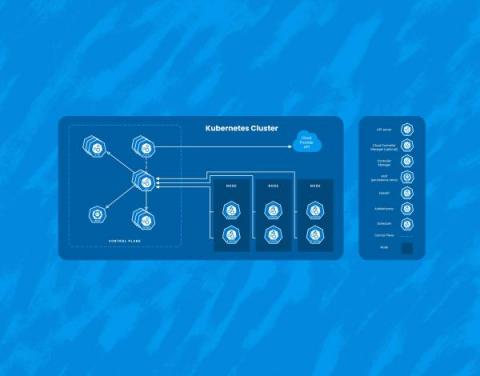
Kubernetes Architecture Part 3: Data Plane Components

This Kubernetes Architecture series covers the main components used in Kubernetes and provides an introduction to Kubernetes architecture. After reading these blogs, you’ll have a much deeper understanding of the main reasons for choosing Kubernetes as well as the main components that are involved when you start running applications on Kubernetes.

PromQL Cheat Sheet: A Quick Guide to Prometheus Query Language

Prometheus is an open-source monitoring and alerting toolkit that has gained significant popularity in DevOps and systems monitoring. At the core of Prometheus lies PromQL (Prometheus Query Language), a powerful and flexible query language used to extract valuable insights from the collected metrics. In this guide, we will explore the basics of PromQL and provide query examples for an example use case.

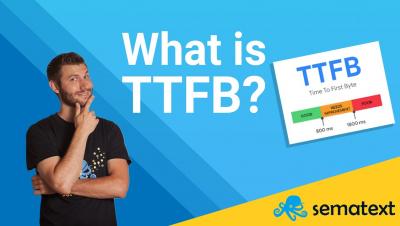
What is TTFB? | Time to first Byte Explained

This video delves into the crucial topic of Time to First Byte (TTFB). Time to First Byte is a vital metric that measures the duration it takes for a user's browser to receive the first byte of data from a web server. By understanding TTFB, you gain valuable insights into the responsiveness and efficiency of your website. Sematext's monitoring tool empowers you to accurately measure and track TTFB across multiple sites without needing local installations.

What is Grafana Scenes? - with Torkel Ödegaard, creator of Grafana (Grafana Office Hours #02)

In GrafanaCON 2023, the latest version of Grafana 10 was announced, and with it, Scenes. But what is Grafana Scenes? Torkel Ödegaard, creator of Grafana and co-founder of Grafana Labs, joins Senior Developer Advocate Nicole van der Hoeven to discuss what Scenes is and how you can use it to create dynamic dashboards like never before.

How Honeycomb Monitors Kubernetes

While Kubernetes comes with a number of benefits, it’s yet another piece of infrastructure that needs to be managed. Here, I’ll talk about three interesting ways that Honeycomb uses Honeycomb to get insight into our Kubernetes clusters. It’s worth calling out that we at Honeycomb use Amazon EKS to manage the control plane of our cluster, so this document will focus on monitoring Kubernetes as a consumer of a managed service.

Logic App Best Practices, Tips, and Tricks: #30 How to validate if a JSON structure is an Array or a single object

In the last two posts, we addressed validating whether a string or an array was null or empty. Today we will continue on the same topic, validations, and I will speak about another good Best practice, Tips, and Tricks that you must consider while designing your business processes (Logic Apps): How to validate if a JSON structure is an Array or a single object.

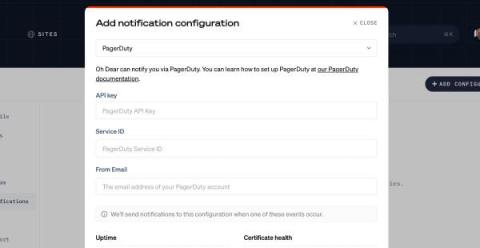
We can now notify you through PagerDuty

When we detect a problem with your site, we can notify you via mail, a Slack message, a webhook, or any of our other notifications channels. This is enough for most of our users, but those who work in larger teams often need more flexibility. Today, we are launching our PagerDuty integration. PagerDuty is a cloud-based incident management platform that helps organizations improve operational reliability by providing real-time alerts, on-call scheduling, and incident tracking.