With the release of Kibana 7.10, dashboards have gained a powerful new feature: URL drilldowns that let you instantly click into any predefined webpage from a visual in a dashboard. Now you can build Kibana dashboards that provide data-driven insights and allow direct actionable paths to the systems you use every day. To learn more about URL drilldowns, be sure to join us for the upcoming webinar, How to build dashboards that drive insight and action in Kibana.
The observability market is undoubtedly hot. Consider the headline-grabbing evidence: multiple IPOs, hundreds of millions of dollars in venture capital funding for startups, and huge market caps of vendors playing in the space totalling more than $80 billion. Still, it has to be asked: Is all the hype warranted, or is this really just “absurdability”? We asked seven industry watchers to weigh in.
Grafana Tempo, the recently announced distributed tracing backend, relies on integrations with other data sources for trace discovery. Tempo’s job is to store massive numbers of traces, place them in object storage, and retrieve them by id. Logs and exemplars allow users to quickly and more powerfully jump directly to traces than ever before. Let’s dig into some examples with a live playground to try it out!
Kibana is for everyone. As the creators of the Elastic Stack, we get a lot of feedback when chatting with our users from all corners of the world during ElasticON events, in GitHub and forums, and while helping folks resolve their support cases. One of the things we've heard in the past is that Kibana is difficult to use. And we've listened to our community!
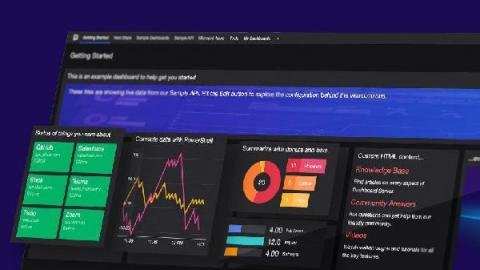
We who use SCOM know about its extensive monitoring capabilities, but the static nature of the SCOM console is not one of its strong points. You can’t drill down to see the data, or correlate data with other data types or alerts for the same object. To the delight of our customers, SquaredUp allows you to do all that and much more – so that you can get all the detail and insight you need, from the metrics you are already collecting.
Grafana is probably the most popular visualization software and a Hosted Grafana is provided by MetricFire. Every day, our users have to perform certain actions and most of them are repetitive. For example, you might want to automatically create a bunch of different folders with dashboards in them. This tutorial will show you how to do that with Terraform, which is very popular in the DevOps circles, and how to go even further by using the client library yourself to automate more.
SCOM is a great solution to monitor your infrastructure. Everything you need for in-depth monitoring is provided out-of-box or with a dedicated management pack. If your organization is genuinely invested with SCOM, you probably also know that you can get in-depth monitoring with SCOM’s Application Performance Monitoring (APM) functionality, and collect events across your servers with SCOM’s Audit Collection Services (ACS).
Grafana vs InfluxDB – Both offer their cloud services for storing, visualizing and alerting on any kind of time-series data. Both cloud offerings differ from each other in various ways and follow distinct pricing strategies. In this article, we cover the details of Grafana as a service and InfluxDB Cloud, their features and benefits along with their pricing models. MetricFire is a Hosted Grafana service, where you can use Grafana dashboards directly in the MetricFire platform.