Operations | Monitoring | ITSM | DevOps | Cloud

Alerting

Building Automated Monitoring with Icinga and iLert

How many servers can be managed by one system administrator? This question is pretty hard to answer since it depends decisively on the tasks that need to be operated. It is clear, however, that the amount of servers one engineer can manage has increased tremendously over the time, and is still growing. Public and private clouds, in combination with automation tools, enables us to automate many daily tasks. In a modern IT infrastructure almost everything can, and should, be automated.

Sending Nagios alerts to Microsoft Teams and rapid incident response with Zenduty

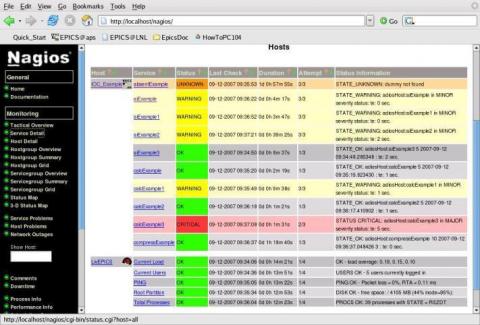
Nagios is one of the most widely used open-source network monitoring software used by thousands of NOC teams globally to monitor the health of a vast array of their hosts and services. Most teams rely on Emails as their primary Nagios alert notification channel, which may take a few minutes to respond to by your NOC team.

FYI: Email Alerting Isn't Enough

Email alerting is an inefficient way to receive and address critical alerts. Email inboxes tend to get flooded with “clutter,” as irrelevant messages bury urgent incident notifications. Incident management procedures require incident management systems, ensuring that urgent issues are immediately addressed. Yet, some services are reluctant to say goodbye to email alerting and its inefficiencies. This is the case with Google Voice, which recently solidified its commitment to email alerting.

What is a Status Page? (& How Does It Benefit Companies/Customers)

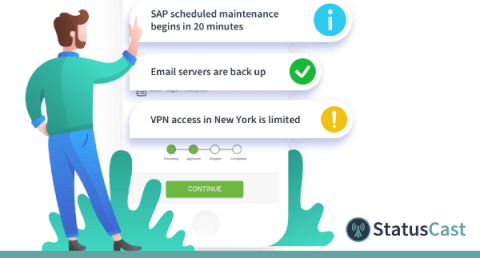
There’s nothing worse than turning on your computer to start the work day and discovering the internet is down. We all know the frustration of tediously trying to figure out what’s wrong before finally breaking down and calling our service provider and waiting on hold, only to discover that it’s a known issue and it’s being addressed. What if there was a better way?

Product Metrics for Discovery Activities

Most companies today compile a set of metrics for their product teams to regularly report on to the company management. This includes a variety of product performance metrics(usage frequency, churn rate, NPS, etc.). But a lot of them struggle a bit with product discovery activities. So how do your track discovery?

Keeping Your CMDB Up To Date in Distributed Times

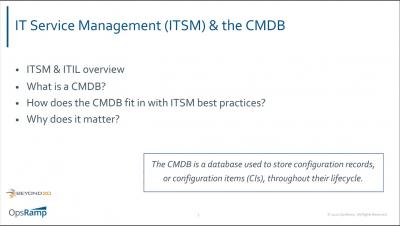
The configuration management database (CMDB) is meant to be a single source of truth to link IT elements with the application processes that underlie the business services. In the age of ITIL, a common repository to store information about your hardware and software assets, made sense. But with today's dynamic and distributed hybrid IT infrastructure, how do you keep your CMDB up to date? Should you even try?

NHS on Its Final Leg of Pager Replacement

If you’ve been following the U.K. healthcare landscape, you would know that the country has been considering replacing pagers for the longest time. This may soon materialize, partly accelerated by the challenges that doctors are facing during the COVID-19 pandemic. The pager replacement initiative not only signifies a pivotal shift from the aging infrastructure, but it also indicates how pagers have failed to thrive in today’s unprecedented times.

Best practices for alerting on Kubernetes

A step by step cookbook on best practices for alerting on Kubernetes platform and orchestration, including PromQL alerts examples. If you are new to Kubernetes and monitoring, we recommend that you first read Monitoring Kubernetes in production, in which we cover monitoring fundamentals and open-source tools. Interested in Kubernetes monitoring?