Operations | Monitoring | ITSM | DevOps | Cloud

Shipped: Allocate AI spend by the tags on your IAM roles

The tags you put on the IAM users and roles that call your models now come through as dimensions you can group and filter on. Tag a role with costCenter, department, email, or name, group by that key, and the model spend those callers drove shows up underneath. That gives you the human-readable half of caller identity. A caller ARN like assumed-role/inference-gateway/session-8842 names a role.

Database monitoring: what to track, which tools to use, and what it all costs

Database monitoring is the continuous tracking of a database's health, performance, and resource consumption, covering metrics like query latency, throughput, connections, and replication lag. In the AI era, it has expanded to include a fifth dimension: spend. Modern teams monitor not just whether the database is fast, but whether the workload it serves is worth what it costs to run. In May 2025, an engineer named Bohan Zhang stood up at PGConf.dev in Montreal and broke every scaling rule in the book.

AI coding tools cost compared: Copilot, Cursor, Claude Code & Codex

AI coding tools cost between $0, on GitHub Copilot's free tier, and $200 per developer per month at list price. GitHub Copilot is cheapest to start at $10. Codex is cheapest per task for ChatGPT subscribers. Claude Code has the most predictable ceiling. Cursor is the most variable. Once agents run all day, vendor-reported usage lands at $100 to $250 per developer monthly, no matter which one you pick.

Codex vs. Claude Code in 2026: cost, capability, and which one your team should pick

Codex is OpenAI's terminal-based autonomous coding agent, bundled into ChatGPT plans and billed through token-based credits. Claude Code is Anthropic's terminal-based coding agent, sold through Claude subscriptions or the API. Codex is cheaper to enter; Claude Code is stronger on complex work. Both run $100 to $250 per developer monthly at active use.

From Code to Runtime: Hands-On Zephyr RTOS Debugging at Microchip MASTERs 2026

Johan Kraft introduces Percepio Tracealyzer during the hands-on Zephyr RTOS debugging class at Microchip MASTERs 2026 in Phoenix. Microchip MASTERs 2026 brought embedded developers together in Phoenix for several days of technical training, hands-on learning and conversations around the challenges engineers are solving every day. Percepio was there, with Founder and CTO Johan Kraft and Product Lead Andreas Klintemyr joining the Microchip community to meet developers, customers and industry partners.

The big question at Black Hat USA 2026: "how do I know?"

Black Hat USA 2026 brought more than 20,000 people to Mandalay Bay in Las Vegas. We were there as a Platinum sponsor at booth 4208, and across two days on the business hall floor we had more than 750 conversations with security engineers and architects. Almost every one of them, whatever it started as, turned into a version of the same question: how do I know? How do I know whether a vendor's AI does what the banner says? How do I know what my agents are doing on the network?

Introducing JFrog Preview: Getting New Capabilities Into Your Hands, Faster

TLDR: “Preview” isn’t a lightweight version of GA, and it isn’t a beta with a new name on it. It just changes the timing and access. You’ll see new JFrog capabilities the day they’re ready for real use, not the day they’re ready for a press release. We’re starting at swampUP 2026. As we know, AI has changed the speed of software development and delivery. Work that used to take three months now takes weeks.

From one switch to a control panel: meet `dataCollection`

This post and its code examples focus on the JavaScript SDKs. If you’re on another platform, it’s still worth reading to understand why we made the change and what’s coming your way. We’re replacing the boolean sendDefaultPii with a new option called dataCollection. The old switch was all or nothing: turn it on and you got everything, leave it off and you got only a fraction.

ISP Local Loop Issues: What They Are, What Causes Them, and How to Diagnose Them

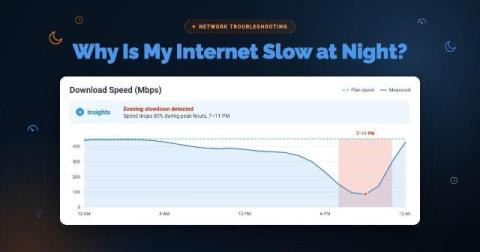
Latency spikes that come and go. Packet loss that shows up for a few minutes, then disappears. None of it traces back to anything on your LAN, your firewall, or your switches because it isn't happening there. It's happening on the physical link between your building and your ISP's network: the local loop. This article covers what the ISP local loop is, what typically goes wrong with it, the most common root causes, and how to diagnose a local loop issue using traceroute data and Obkio Insights.