Operations | Monitoring | ITSM | DevOps | Cloud

Blog

Watchdog: Auto-detect performance anomalies without setting alerts

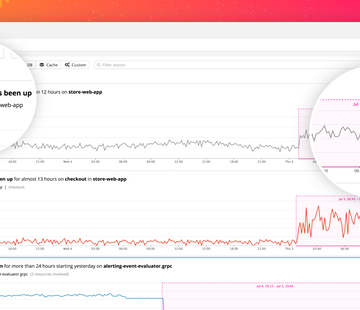
With anomaly detection, outlier detection, forecasting, and composite alerting, Datadog enables you to reliably alert the right people at the right time. But what happens when latency starts to increase, or error rates spike, in areas of your application where you haven’t set alerts? That’s what Watchdog is for.

Guest Blog Post: Ballerina Makeover with Grafana

In this guest blog post from the folks at Ballerina, Anjana shows you how you can easily visualize metrics from a Ballerina service with Grafana, walking you step by step through the installation and configuration of the components. They’ve also extended an offer for a free ticket to their upcoming Ballerinacon to the Grafana community.

Runtime container security - How to implement open source container security (part 1).

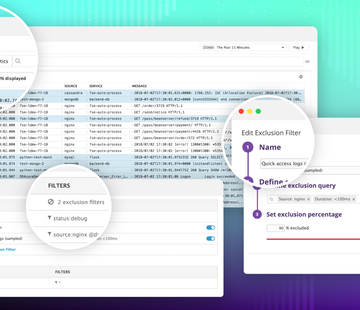
Container security is top-of-mind for any organization adopting Docker and Kubernetes, and this open source security guide is a comprehensive resource for anyone who wants to learn how to implement a complete open source container security stack for Docker and Kubernetes.

AppDynamics - Our Next 10 Years

Recently, the employees of AppDynamics celebrated our 10th anniversary as a company, as well as the 1st anniversary of our acquisition by Cisco. We’ve experienced so much growth and so many positive changes over this past year, it’s enough to make our heads spin! However, it’s safe to say that AppDynamics isn’t close to slowing down.

A Guide To Service Level Objectives, Part 1: SLOs & You

Four steps to ensure that you hit your targets – and learn from your successes. Whether you’re just getting started with DevOps or you’re a seasoned pro, goals are critical to your growth and success. They indicate an endpoint, describe a purpose, or more simply, define success. But how do you ensure you’re on the right track to achieve your goals?

There And Back Again: A Honeycomb Tracing Story

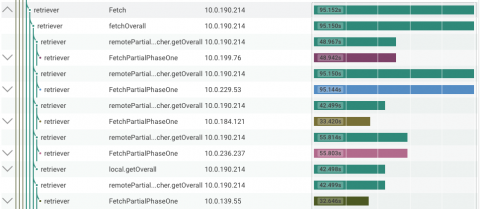
In our previous post about Honeycomb Tracing, we used tracing to better understand Honeycomb’s own query path. When doing this kind of investigation, you typically have to go back and forth, zooming out and back in again, between your analytics tool and your tracing tool, often losing context in the process.

Enhance Your Business Suite with ConnectWise and OpsGenie

OpsGenie and ConnectWise have a bidirectional integration that brings value to your teams by allowing you to manage incidents with ease and speed, notify the right people of ConnectWise alerts at the right time according to schedules and escalations, and the integration’s bidirectional functionality allows information to both be sent to and from OpsGenie and ConnectWise.

How Can I Use Microsoft SCOM for End-to-End Performance Monitoring

Microsoft System Center Operations Manager (SCOM) deployments have been on the rise in recent years mainly due to its tight integration with other Microsoft servers and applications in the enterprise. While SCOM has native support to monitor Microsoft infrastructures, there is no out-of-the-box support for non-Microsoft technologies, such as VMware, Oracle, Citrix, SAP, and so on.