Operations | Monitoring | ITSM | DevOps | Cloud

Raygun

Sponsored Post

APM isn't just for Ops: Shifting Left and supercharging your developers

When we were rethinking what an Application Performance Monitoring product could be, we did what we always did. We thought of developers, and the ultimate users that they serve. It's no surprise then that two years back, we built an all-new take on APM from scratch. One that armed developers with the level of insights that they need to deliver great software. Fortunately, we seemed to be onto something here. The relics of the past are now starting to talk about "shifting left," meaning "moving to the left on the SDLC," meaning "empower the developers to get in earlier in the delivery to ensure a great outcome."

Raygun NZ Hi-Tech Awards 2020 - Most Innovative Hi-Tech Software Solution

We're honored to be presented with the Most Innovative High-Tech Software Solution Award at the NZ Hi-Tech Awards. Raygun isn't just a business, it's an assortment of amazingly talented and passionate pioneers, pushing the definition of high-quality user experiences to greater and greater heights. Start your free 14-day trial of Raygun today!

How we scale Raygun's architecture to handle more data

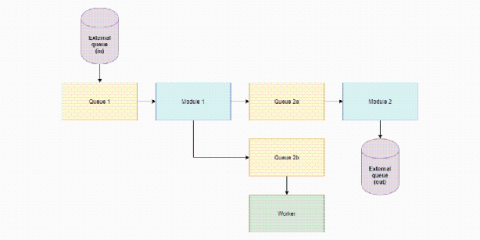
Due to the huge importance of sourcemaps in the workflow of our customers, sourcemaps are a crucial part of our Crash Reporting offering. We constantly strive to stay ahead of our customer demands as the amount of data we process continues to grow. We identified the sourcemapping process as an area ripe for performance improvement, so we took it apart and looked at exciting ways to build it from the ground-up using cutting-edge tech.

Debug JavaScript in Google Chrome's Dev Tools in 7 easy steps

This article will focus on debugging JavaScript code within Google Chrome’s Developer Tools. Chrome’s Developer Tools are extremely powerful and will almost certainly speed up your troubleshooting process. We’ll be using Raygun Crash Reporting to find the stack trace and the line of code the error occurred on. You can sign up for a free 14-day trial here. So, let’s dive in!

Visualize performance trends over time with the latest graph for RUM

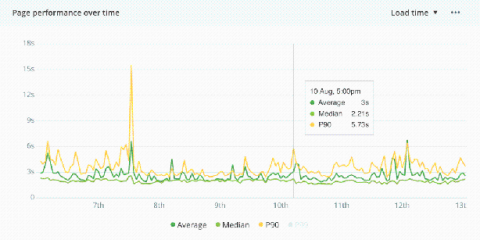
Monitoring trends in application performance helps you identify poor performance and visualize the impact of performance optimizations you’ve made. To help you better monitor performance trends, we’ve released a new line graph now available across all performance details pages in Real User Monitoring.

How we made an 83% performance improvement using Real User Monitoring

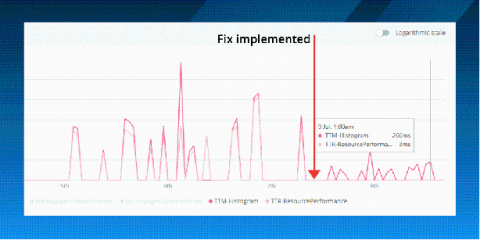
As applications evolve, we may start to lose visibility into why things are slow. Web apps often suffer in silence as customers are more likely to leave when they’re unsatisfied rather than reach out. Complex user flows, resource-intensive API calls, and an ever-growing codebase can all contribute to poor performance. This is why we don’t have scheduled performance days.
Sponsored Post

Control the chaos - The importance of monitoring traffic spikes

You've spent years scaling your infrastructure alongside your business growth, and day-to-day, your application performance is thriving. But what happens when your traffic spikes out of your predicted "normal" range, heading into unchartered territory? Are you prepared to support this new influx of customers? Or will you crumble under the pressure of it all - leaving customers dissatisfied at the poor user experience?

How Raygun increased transactions per second by 44% by removing Nginx

Here at Raygun, improving performance is baked into our culture. In a previous blog post, we showed how we achieved a 12% performance lift by migrating Raygun’s API to .NET Core 3.1. In publishing this, a question was asked on Twitter as to why we still use Nginx as a proxy to the Raygun API application. Our response was that we thought this was the recommended approach from Microsoft. It turns out this has not been the case since the release of .NET Core 2.1.

Debug JavaScript in Microsoft Edge in 7 steps

This article will focus on debugging JavaScript code within Microsoft Edge Developer Tools. The Edge DevTools are a powerful toolset built into the Edge browser on Microsoft Windows 10. The DevTools are also available as a standalone app to download from the Microsoft Store, if one prefers to run them separately from Edge itself. We’ll be using Raygun Crash Reporting to find the stack trace and the line of code the error occurred on. You can sign up for a free 14-day trial here.