Operations | Monitoring | ITSM | DevOps | Cloud

Cloud Computing; Basic Walk-through

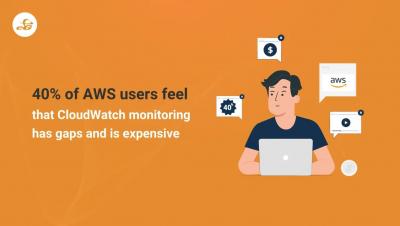
Cloud computing is the on demand delivery of IT solutions. Instead of investing capital in buying, owning, and maintaining physical servers and data centers, cloud computing enable the organizations to access the services such as, computing, storages, and databases, whenever required from the desired cloud providers. Now, let us move ahead and have a look at some of the key benefits of cloud computing.

SCOM 2022: What to expect and what you need to know

Microsoft System Center Operations Management team has been busy with new features and updates for SCOM. The most recent version, SCOM 2019, came out on March 14th, 2019. The release date for the upcoming SCOM 2022 has been announced to be globally available in Q1 2022. This blog post will provide an overview of some of the features you can expect to see in SCOM 2022 and how those changes may affect your experience of SCOM monitoring as a user or customer.

7 Tips for Hyper-V Monitoring that Will Boost Your VM Performance

Hyper-V is one of the most popular virtualization software, especially for Windows systems and servers. However, no software or tool can be optimized to your advantage without proper monitoring. Now, you’re probably already monitoring your Hyper-V environments, but are you doing it the best way? This post will reveal seven important tips that can help reinforce your efforts to Hyper-V monitoring, especially cluster monitoring, which is a hard task.

The 18 most popular data source plugins for Grafana in 2021

As a composable solution, Grafana allows you to bring your data into dashboards natively without having to extract it, load it, or transform it. We believe in a “big tent” philosophy, which allows you to choose the tools that best suit your observability strategy, and with our plugins, Grafana is interoperable with more than 100 data sources.

New Apps for PagerDuty's Datadog Integration

Status Dashboard by PagerDuty and Incidents by PagerDuty are new apps available now in Datadog. See a live, shared view of system health to improve awareness of operational issues with Status Dashboard by PagerDuty. Acknowledge, troubleshoot, and resolve incidents with PagerDuty actions embedded directly in the Datadog interface to limit context switching among tools. Julia Nasser and Hadijah Creary join the stream to show off this powerful enhanced integration.

Make sense of complex systems with Dynamic Service Graph by PagerDuty

The Dynamic Service Graph breaks down silos between teams and provides organizations with a living, breathing asset that displays technical and business services and their relationships at scale. It allows teams to quickly grasp the state of services, visually digest the full impact radius of an issue, zero in on likely cause, and seamlessly facilitate cross-team collaboration.