Mailchimp
Not subscribed to OpsMatters Newsletter


2020 was a year of tremendous dejection and disruption. Imagine if you had told your organization’s upper management that they had to switch their 10,000 or 20,000 strong corporate office to the virtual world back in January 2020. They would have flipped. Despite all the fear and loss that 2020 brought, we capitalized on the opportunities. And even a year later, there are still possibilities galore.
Application slowdowns, poor Internet speed, and laggy video calls are always frustrating. Whether you’re working in an office, or working from home, it’s important to keep an eye on the applications that matter most. In this article, we’re teaching you how to monitor the network performance of Google apps, including Google Meet, Google Workspace, Gmail & Google Calendar.
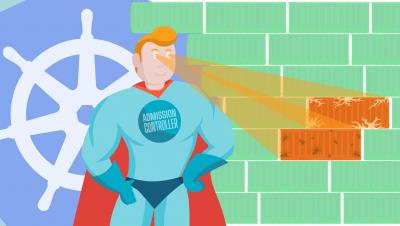
Admission controllers are a powerful Kubernetes-native feature that helps you define and customize what is allowed to run on your cluster. As watchdogs, they can control what’s going into your cluster. They can manage deployments requesting too many resources, enforce pod security policies, and even block vulnerable images from being deployed. In this article, you’ll learn what admission controllers are in Kubernetes and how their webhooks can be used to implement image scanning.
Picture the scene. It’s 9am on a cold, wet, January Sunday morning in 2015 and I’m trudging up Merrion Street in Leeds. Recently made redundant, I’m on my way to a coffee shop that I’m desperately hoping is open. Am I a coffee aficionado desperate for a fix? Am I getting pumped for a gym session? Do I just enjoy walks in the rain? No. I’m on my way to a job interview.
As part of a modern software development team, you’re asked to do a lot. You’re supposed to build faster, release more frequently, crush bugs, and integrate testing suites along the way. You’re supposed to implement and practice a strong DevOps culture, read entire novels about SRE best practices, go agile, or add a bunch of Scrum ceremonies to everyone’s calendar.
Grafana Cloud is the easiest way to get what you need for observability: Prometheus and Graphite for metrics, Loki for logs, and Tempo for tracing, all integrated within Grafana and managed by the Grafana Labs team. You can go from zero to beautiful graphs, insightful logs, and preconfigured alerts in minutes. Built with modern distributed systems techniques, Grafana Cloud allows you to grow with your applications and infrastructure and easily scale past 100M+ metrics.