Mailchimp
Not subscribed to OpsMatters Newsletter


Amazon Elastic Container Service (ECS) is an orchestration service for Docker containers running within the Amazon Web Services (AWS) cloud. You can declare the components of a container-based infrastructure, and ECS will deploy, maintain, and remove those components automatically. The resulting ECS cluster lends itself to a microservice architecture where containers are scaled and scheduled based on need.
In Part 1, we introduced a number of key metrics that you can use for ECS monitoring. Monitoring ECS involves paying attention to two levels of abstraction: the status of your services, tasks, and containers, as well as the resource use from the underlying compute and storage infrastructure, monitored per EC2 host or Docker container. In this post, we’ll survey some techniques you can use to monitor both levels of your ECS deployment.
As we explained in Part 1, it’s important to monitor task status and resource use at the level of ECS constructs like clusters and services, while also paying attention to what’s taking place within each host or container. In this post, we’ll show you how Datadog can help you: Automatically collect metrics from every layer of your ECS deployment, Track data from your ECS cluster, plus its hosts and running services in dashboards, and more.
Google Kubernetes Engine (GKE) is a managed Kubernetes service that makes it possible to run Kubernetes clusters without managing the underlying infrastructure. With GKE, DevOps teams can scale and deploy applications faster with Kubernetes, while spending less time on cluster maintenance and configuration. Obtaining enough insight into GKE is key to proactively preventing downtime and maximizing application performance.
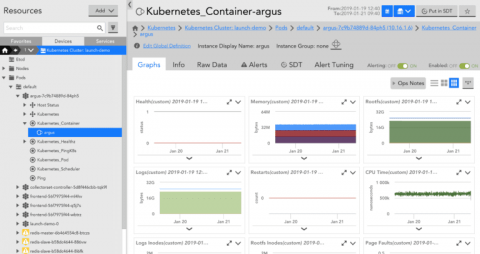
There’s no denying it — Kubernetes has become the de-facto industry standard for container orchestration. In 2018, AWS, Oracle, Microsoft, VMware and Pivotal all joined the CNCF as part of jumping on the Kubernetes bandwagon. This adoption by enterprise giants is coupled by a meteoric rise in usage and popularity. Yet despite all of this, the simple truth is that Kubernetes is hard.
Netlify functions are a quick, easy and powerful tool, but like most serverless platforms, they can be even more difficult to debug and monitor than traditional server applications. It’s a hard environment to precisely recreate locally, there’s no machine you can SSH into in a pinch, and no built-in error notifications. Your code is going to break eventually, and you need the tools to fix it.