Mailchimp
Not subscribed to OpsMatters Newsletter


As you operate and scale ActiveMQ, comprehensive monitoring will enable you to rapidly identify any bottlenecks and maintain the flow of data through your applications. Earlier in this series, we introduced some key ActiveMQ metrics to watch, and looked at some tools you can use to monitor ActiveMQ.
AWS Lambda can use stream based services as invocation sources, essentially making your Lambda function a consumer of those streams. Stream sources include Kinesis Streams and DynamoDB streams. When you allow streams to invoke your Lambda function, Lambda will emit a CloudWatch metric called IteratorAge. In this post, we discuss what this metric is and how to fix it if it’s too high.
Sematext provides a single pane of glass and machine learning powered alerts for logs, metrics, traces and digital user experience data. The new Sematext agent is fully Docker Engine and Kubernetes-aware. (Re)written in Go, it has a minimal memory and CPU footprint. It also collects Kubernetes metrics in the most optimal fashion possible.
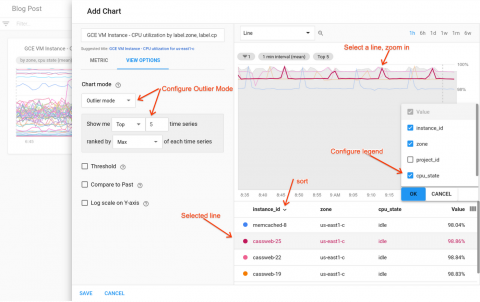
Seeing what’s going on with your IT infrastructure, applications and services has always been critical to the success of modern businesses’ day-to-day operations. Google Stackdriver monitoring provides out-of-the-box visualizations and insights for Google Cloud Platform (GCP) users so you can easily understand your systems.
Remember that time Mom told you that the internet is a dangerous place? No? Well, she did, but you weren’t listening. Jokes aside, we can probably all agree that there are many potential security risks in web services, with all their APIs and user-contributed content. Yet, the internet is what defines our digital age, and barely any piece of technology can do without. In the midst of this insecurity, Rust came along with its memory safety and zero-cost abstractions.