Dashboards
How to set up home automation: A beginner's guide with Grafana Cloud and Home Assistant
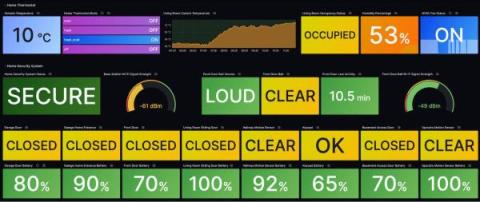
I first learned about Home Assistant when my previous job’s manager shared that he charms his wife by using home automation to have Alexa announce the weather as she starts getting ready for the day. After that, he showed us the cool Grafana dashboards where he visualizes his entire home automation setup on a screen in his basement. As fate would have it, I got a chance to work for Grafana Labs soon after that, and I started building my own home automation setup using Grafana Cloud.
How to deploy Grafana Beyla on Kubernetes as a sidecar container
Monitor Amazon EC2: key metrics for instances, regions, and more in one view
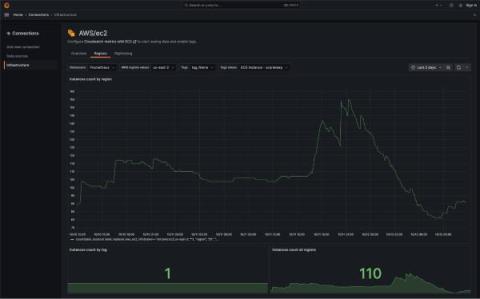
Amazon EC2 was one of the first services available on AWS, helping propel the cloud platform into the mainstream of IT. And while EC2 instances come in a wide range of sizes and flavors to address all sorts of use cases, keeping tabs on those instances isn’t always easy. That’s why we’re excited to introduce our new EC2 monitoring solution in Grafana Cloud.
Dashboards - Sumo Logic Customer Brown Bag - Logging - January 8th, 2024
Observability trends and predictions for 2024: CI/CD observability is in. Spiking costs are out.
From AI to OTel, 2023 was a transformative year for open source observability. While the advancements we made in open source observability will be a catalyst for our continued work in 2024, there is even more innovation on the horizon. We asked seven Grafanistas to share their predictions for which observability trends are on their “In” list for 2024. Here’s what they had to say.
Grafana 10.2.3 release: new features and breaking changes
On Dec. 18, 2023, we unintentionally introduced some new features and two minor breaking changes in the Grafana 10.2.3 patch release. These changes were originally intended for Grafana 10.3, which we plan to release later this month, but these commits were merged into the 10.2.3 release branch early due to a mistake in our release process. Because Grafana 10.2.3 introduces more changes than expected in a typical patch release, there’s a risk of more bugs than expected.
Introduction to eBPF with Grafana Beyla, with Nikola Grcevski (Grafana Office Hours #25)
Teams Call Quality Dashboard: The First Step In Teams Insight
Do you have much experience using the Call Quality Dashboard (CQD)? Does your team go on about it being a ‘good starting point’? Do you even know what the CQD does? Fear not. If you answered ‘no’ to any of those questions, we’re going to fill you in with all the details that matter and give you some additional direction on how to get the most out of them. The bottom line is they’re a good starting point, but a long way from being a proactive performance solution.
The concise guide to Loki: How to work with out-of-order and older logs
For this week’s installment of “The concise guide to Loki,” I’d like to focus on an interesting topic in Grafana Loki’s history: ingesting out-of-order logs. Those who’ve been with the project a while may remember a time when Loki would reject any logs that were older than a log line it had already received. It was certainly a nice simplification to Loki’s internals, but it was also a big inconvenience for a lot of real world use cases.


