Dashboards
How the LGTM Stack changed the observability culture at Wise Payments
Best practices to scale and modernize your observability strategy
ObservabilityCON 2023 took place in London this week, showcasing all the latest and greatest trends in open source observability. Following the opening keynote, the event featured a range of breakout sessions — led by both Grafana Labs experts and members of the Grafana OSS community — that explored observability best practices and lessons learned.
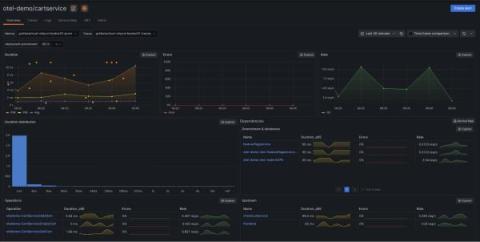
The Grafana OpenTelemetry Distribution for Java: Optimized for Application Observability
The OpenTelemetry project provides many different components and instrumentations that support different languages and telemetry signals. However, new users often find it hard to pick the right ones and configure them properly for their specific use cases. For this reason, OpenTelemetry defines the concept of a distribution, which is a tailored and customized version of OpenTelemetry components. Here at Grafana Labs, we are all-in on OpenTelemetry.
The Grafana OpenTelemetry Distribution for .NET: Optimized for Application Observability
The OpenTelemetry project provides many different components and instrumentations that support different languages and telemetry signals. However, new users often find it hard to pick the right ones and configure them properly for their specific use cases. For this reason, OpenTelemetry defines the concept of a distribution, which is a tailored and customized version of OpenTelemetry components. Here at Grafana Labs, we are all-in on OpenTelemetry.
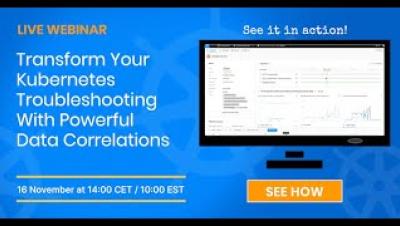
Transform Your Kubernetes Troubleshooting With Powerful Data Correlations
Dashboarding Azure Monitor SCOM MI in SquaredUp
Big news! Microsoft have just dropped Azure Monitor SCOM Managed Instance (SCOM MI), their cloud-based alternative to SCOM. It’s fully Microsoft managed, and so it promises to take the headache out of deploying, scaling, and managing your SCOM Management Groups. Read Microsoft’s announcement blog to learn all about it.
What is DevOps? Grafana for Beginners Ep.2
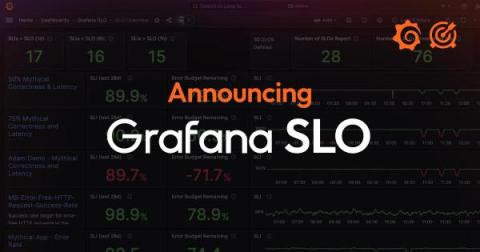
Set and scale service level objectives in Grafana Cloud: Introducing Grafana SLO
When we began offering Grafana Cloud Metrics, we set a service level agreement (SLA) for 99.5% of requests to be completed within a few seconds. So we built an alert that would go off if more than 0.5% of requests were slower than a couple of seconds within a five-minute moving window. Sounds reasonable, right?

