Dashboards

Multiple players, one stack: Inside Roblox's centralized observability stack

When you sign into the Roblox platform, you get 30 million immersive experiences, ranging from concerts to fashion shows to, of course, video games. But when the observability team at Roblox logs on, they’re not playing around. The Roblox observability engineers are responsible for keeping more than 214 million monthly users happy and engaged by making the wildly popular gaming platform highly available around the world.

Supercharging Grafana with the Power of Telemetry Pipelines

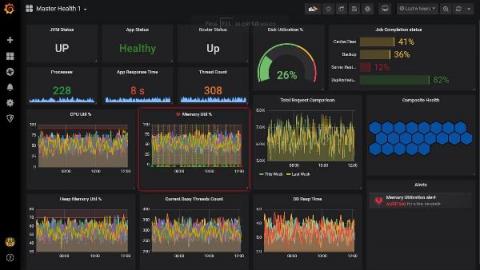
Grafana is a popular open-source tool for visualizing and analyzing data from various sources. It provides a platform for creating interactive, customizable dashboards that display real-time data in various formats, including graphs, tables, and alerts. When powered by Mezmo's Telemetry Pipeline, Grafana can access a wide range of data sources and provide a unified view of the performance and behavior of complex systems.

Find connections and expand your data visualization with new dashboards

One of my favorite movies of all time is WarGames, which depicted a teenage hacker accidentally breaking into NORAD and starting a nuclear war simulation that almost turned into a real catastrophe. The movie featured state-of-the-art dashboards (at least for 1983) showing simulated missile launches by different countries. Now you can create Sumo Logic dashboards like the ones shown in this movie using our new Connection Map panel.

Best Grafana dashboard for IoT Device monitored via MQTT metrics and Graphite

Internet-of-Things (IoT) devices and technologies have penetrated into our life. Nowadays, we can easily find IoT devices around us. Home appliance manufacturers produce IoT products for smart homes. Car makers invest in smart vehicles that can communicate with other smart cars and IoT objects nearby. Governments allocate huge resources to build smart cities with IoT technologies to improve the quality of life for people and promote economic growth.

Learn how to monitor IoT devices with Grafana

IoT devices open the door to all sorts of computing potential, but they can also produce a flood of telemetry data that users need to properly collect and monitor to ensure those devices are working properly. It’s no wonder so many individuals and businesses use Grafana for IoT use cases, whether they’re starting an aquaponic farm in South Africa, managing an industrial-scale electroplating factory in Ohio, or simply keeping tabs on Pretzel the python at its home in the UK.

Cloud Monitoring Console's Health Dashboard: Maximize Your Monitoring Efficiency

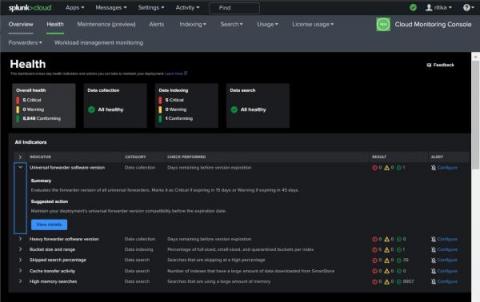
Are you a Splunk Cloud admin tired of sifting through various tools and dashboards to monitor the health of your Splunk Cloud deployment? Do you often find yourself wondering what actions you can take to keep your Splunk Cloud deployment running smoothly? Are you looking for ways to be alerted before something impacts your deployment performance? Look no further than the Cloud Monitoring Console's Health Dashboard!

Grafana vs Graphite: A Comparison for Data Visualization and Analysis

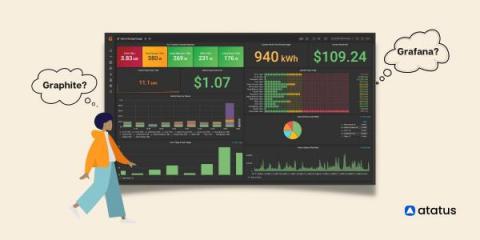
Data generation today is at an unprecedented level, and we are generating an inexhaustible amount of data. As a matter of fact, more data has been created over the past two years than ever before in the history of mankind. This throws a big complexity in front of us. How do we even manage such a huge amount of data? Where do we store them? Can they be segregated to fit into our needs, who would do that for us, and so on! The questions are endless, and so is the rate of generation of new data.

Observability overload: Insights into the rise of tools, data sources, and environments in use today

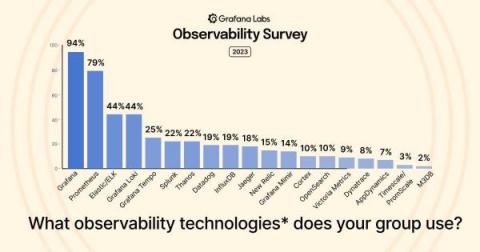
With countless observability tools, data sources, and environments to juggle, the organizations that deploy and manage today’s distributed applications often face an uphill battle to gain visibility into their application performance. That was a key takeaway from the Grafana Labs Observability Survey 2023, which incorporated input from more than 250 industry practitioners who are all too familiar with these complexities.

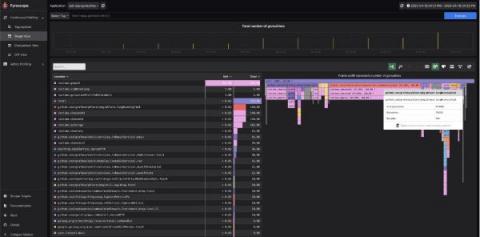
How to troubleshoot memory leaks in Go with Grafana Pyroscope

Memory leaks can be a significant issue in any programming language, and Go is no exception. Despite being a garbage-collected language, Go is still susceptible to memory leaks, which can lead to performance degradation and cause your operating system to run out of memory. To defend itself, the Linux operating system implements an Out-of-Memory (OOM) killer that identifies and terminates processes that consume too much memory and cause the system to become unresponsive.

Grafana Cloud is now available in AWS Marketplace

Grafana Labs is excited to announce that Grafana Cloud is now available in AWS Marketplace. With this new offering, existing AWS customers can procure, deploy, and scale the fully managed Grafana LGTM observability stack (Loki for logs, Grafana for visualization, Tempo for traces, Mimir for Prometheus metrics) with just a few clicks.