Dashboards

Grafana dashboards in 2022: Memorable use cases of the year

One of our favorite things at Grafana Labs is seeing Grafana dashboards in action. Over the past year, members of the Grafana community — from inside and outside of the company — shared the unique ways they have used dashboards to monitor a wide range of projects including an elderly parent’s home, a Tesla, and a python named Pretzel. Let’s take a look back at some of the eye-catching and informative results.

Grafana Cloud 2022: Year in review

With every new update and feature we introduced to our open source LGTM stack this year, we have also enhanced Grafana Cloud, our hosted offering that is powered by Grafana Loki for logs, Grafana for visualization, Grafana Tempo for traces, and Grafana Mimir for metrics. With Grafana Cloud, “we have curated the open source experience into an easy-to-use, opinionated, and integrated platform,” Grafana Labs VP of Technology Tom Wilkie said in the ObservabilityCON 2022 keynote.

Open source at Grafana Labs in 2022: Year in review

At Grafana Labs, we’re all about open source, and this year we took it to a whole new level. Many of you are familiar with the acronym “LGTM,” which is shorthand for “Looks good to me” and commonly used in code reviews. At Grafana Labs, LGTM has also been a guiding rubric in developing our observability stack.

Dashboard Fridays: Sample Google Kubernetes Engine Dashboard

This SquaredUp dashboard shows key metrics from any GKE (Google Kubernetes Engine) clusters and node groups, including utilization of resources and health status. Tune in to learn how it was made, the challenges it solves, and our top tips for building it yourself.

Dashboard Fridays: Sample Grafana Dashboard

This SquaredUp Grafana dashboard surfaces status information from Grafana, giving you a big picture overview across teams and apps – all while allowing you to utilize your existing dashboards and alert rules. Tune in to learn how it was made, the challenges it solves, and our top tips for building it yourself.

Dashboard Fridays: Sample Google Compute Engine Dashboard

This Google Compute Engine dashboard shows key metrics about any GCE instances, managed instance groups, and related resources such as GCE disks. These metrics include utilization of resources and health status. Tune in to learn how it was made, the challenges it solves, and our top tips for building it yourself.

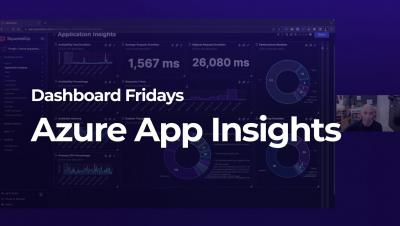
Dashboard Fridays: Sample Azure Application Insights Dashboard

This SquaredUp dashboard uses the Azure plugin to surface key performance metrics from Application Insights. Common user experience metrics are all provided out of the box, and we can query, summarize, and analyse the raw logs and traces. Tune in to learn how it was made, the challenges it solves, and our top tips for building it yourself.

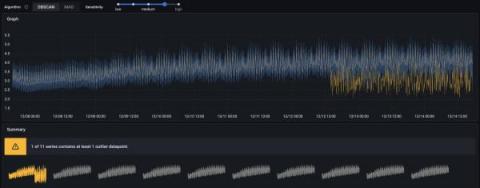
Introducing Outlier Detection in Grafana Machine Learning for Grafana Cloud

Outlier Detection is now available as part of the Grafana Machine Learning toolkit in Grafana Cloud for Pro and Advanced users. With this feature, you can monitor a group of similar things, such as load-balanced pods in Kubernetes, and get alerted when some of them start behaving differently than their peers. There’s supposed to be a video here, but for some reason there isn’t. Either we entered the id wrong (oops!), or Vimeo is down.