Dashboards
Grafana Agent v0.30: Flow adds support for logging pipelines and graduates to beta
Grafana Agent v0.30 is here! The past couple of Grafana Agent releases have been pretty exciting for us. We introduced Agent Flow as a new way to configure, run, and debug telemetry pipelines. We also announced OpenTelemetry Collector components to expand on our Big Tent philosophy and allow users to switch seamlessly between the Prometheus and OTel ecosystems. This latest release continues that momentum by introducing Loki components for building logging pipelines and marking Flow mode as beta!
Jira Automation Demystified
Repetitive tasks can be time consuming. In an ideal world, automation would remove all of the grunt work when it comes to solving business problems, freeing us up to execute on more strategic decisions. Luckily, Jira has the capabilities to take a load of tasks off your hands – including tracking your issues, posts, features, and more. This blog will walk you through the options available and offer top tips on how to set this up.
Dashboard Fridays: Zendesk
Dashboard Fridays: CircleCI
Dashboard Fridays: Azure DevOps
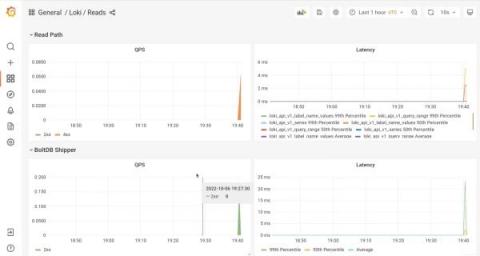
The only Helm chart you need for Grafana Loki is here
The community has spoken, six Helm charts is not enough! We agree! In all seriousness though, six charts is simply too many to maintain. And while it might sound counterintuitive, that’s why we are announcing a new Helm chart. By focusing on the “Grafana Labs way" to run Grafana Loki using Helm, we believe this will help us and the community concentrate our Helm efforts into a single chart. This new chart is released under grafana/loki at Helm version 3 or higher.
LM Envision Application Topology: A New Way To Visualize Application Connections
How KCB Bank Uganda greatly improved transaction service monitoring with Grafana
In 2019, KCB Bank Uganda reviewed its systems and came to a startling realization: Due to outdated monitoring processes, its services could be down for hours before anyone was alerted internally. This downtime led to frustrated consumers, a rise in customer service complaints, and a decline in revenue.

