Dashboards
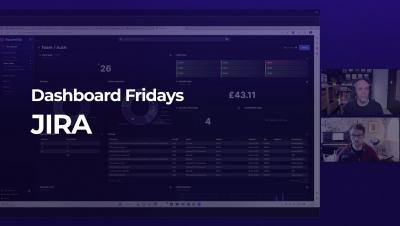
Dashboard Fridays: Sample Jira Dashboard
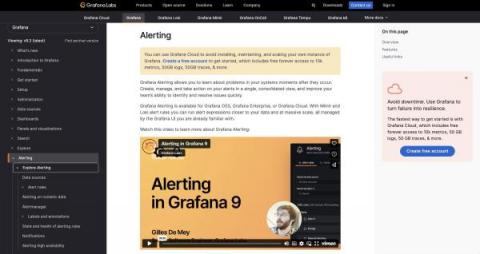
Grafana documentation: A look at the new and improved design
We recently launched a new design for our technical documentation. The goal of the redesign was to make our technical documentation more accessible, modern, and scalable as we grow. In addition to a new look (hello, new typeface and layout!), our updated docs pages reveal the underlying work our team has done to evolve and enhance our technical documentation.
How Grafana Labs uses and contributes to OpenCost, the open source project for real-time cost monitoring in Kubernetes
While more and more teams are adopting Kubernetes as their standard container orchestration technology, cost insight is lacking. Teams often don’t know how much they’re spending, where in their organization they are spending, or what is driving their infrastructure cost increases. OpenCost helps alleviate this problem by bringing real-time cost monitoring to Kubernetes workloads with a solution that encompasses both an open specification and an open source project.
Helm-Dashboard Crosses 3K Stars As v. 1.0.0 Released
Our latest open-source project, Helm-Dashboard, just crossed 3K stars on GitHub (and hundreds of daily active users), only three months since it was released! We thought this milestone was a good chance to take a look back at our journey, announce the release of v. 1.0.0, discuss future plans, and, most importantly, give our utmost thanks to the amazing contributors and Kommunity members that made it all possible! What capabilities would you like to see next in Helm-Dashbaord?
New in Grafana Tempo 2.0: Apache Parquet as the default storage format, support for TraceQL
Grafana Tempo 2.0 is finally here, and it’s being released with two new important features. It took us longer than we would have liked to get this release going, but it turns out that rewriting your backend AND building a new query language is quite difficult. Thanks to a massive team effort, we are proud to release Tempo with support for TraceQL and with Apache Parquet as the default backend storage format. Read on to get a quick overview of this huge release.
Grafana Agent v0.31 release: new Helm chart, Flow support for Grafana Phlare, and more
Here at Grafana Labs, we aim to create products which integrate well with open standards and are easy to install everywhere. Today, we’re excited to announce Grafana Agent v0.31, which allows you to connect to even more types of observability signals for both scraping and remote writes. And to help you install the Agent more easily, there is now an official Windows Docker image and an official Helm Chart. Here’s a breakdown of the latest features and upgrades in Grafana Agent v0.31.
AIOps Insights from dashboards on Elastic Observability
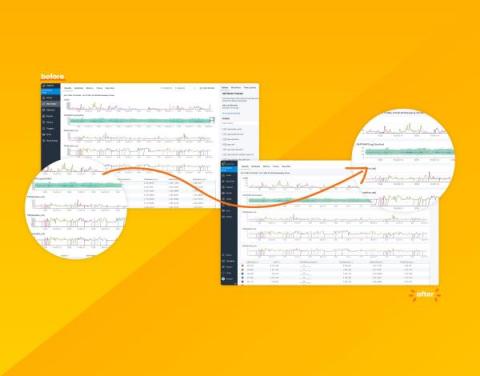
Your Data Just Got a Facelift: Introducing Honeycomb's Data Visualization Updates
Data visualizations take complex information and present it in a clean and easy-to-understand visual. Done right, they can allow quick insight through easy pattern and outlier recognition. Done wrong, it can confuse, obfuscate, and lead to wrong conclusions. Yikes! Over the past few months, we've been hard at work modernizing Honeycomb’s data visualizations to address consistency issues, confusing displays, access to settings, and to improve their overall look and feel.
A beginner's guide to Kubernetes application monitoring
Application performance monitoring (APM) involves a mix of tools and practices to track specific performance metrics. Engineers use APM to monitor and maintain the health of their applications and ensure a better user experience. This is crucial to high quality architecture, development, and operations, but it can be difficult to achieve in Kubernetes since the container orchestration system doesn’t provide an easy way to monitor application data like it does for other cluster components.

