Operations | Monitoring | ITSM | DevOps | Cloud

The latest News and Information on Monitoring for Websites, Applications, APIs, Infrastructure, and other technologies.

Top Features of Grafana Versions 7 & 8

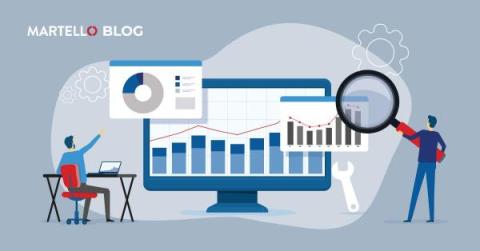
Grafana is a monitoring system that helps you visualize your infrastructure and provides notifications when errors occur. It offers interesting features on some versions as it's the case on v7 and v8. We will go through some that are very interesting in particular Panel editor, Tracing UI, bar graph, and visualization. With MetricFire specializing in hosted monitoring, you can easily make a Grafana dashboard by booking a demo or signing on to the free trial immediately.

Preventing Outages: Implement an Internet Performance Monitoring Plan

Just implementing Internet Performance Monitoring (IPM) is only a first step. A complete and thoughtful Internet Performance Monitoring (IPM) Plan is essential to ensure user experience over time. Your Internet Performance Monitoring (IPM) plan should include: Watch Howard Beader and Akshita Agarwal as they teach the steps required to create a successful IPM plan.

ExpressJS Container Debugging

In recent years, the landscape of application development has experienced a paradigm shift, largely driven by the rise of containerization and microservices architectures. Amid this transformation, Express.js has emerged as a dynamic and versatile framework that stands as a one-stop shop for crafting robust web applications. Its popularity owes much to its minimalist approach, allowing developers to swiftly build APIs and web applications with ease.

Honeycomb + Tracetest: Observability-Driven Development

Our friends at Tracetest recently released an integration with Honeycomb that allows you to build end-to-end and integration tests, powered by your existing distributed traces. You only need to point Tracetest to your existing trace data source—in this case, Honeycomb. This guest post from Adnan Rahić walks you through how the integration works.

Comparing Six Top Observability Software Platforms

When it comes to observability, your organization will have no shortage of options for tools and platforms. Between open source software and proprietary vendors, you should be able to find the right tools to fit your use case, budget and IT infrastructure. Observability should be cost-efficient, easy to implement and customers should be provided with the best support possible.

Coralogix vs Splunk: Support, Pricing and More

Splunk has become one of several players in the observability industry, offering a set of features and a specific focus on legacy and security use cases. That being said, how does Splunk compare to Coralogix as a complete full-stack observability solution? Let’s dive into the key differences between Coralogix vs Splunk, including customer support, pricing, cost optimization, and more.

Introducing Rage & Dead Click Detection for Session Replay

Sentry developers work ridiculously hard to make sure that every update makes the developer experience better. And, just like you, we use Sentry to monitor…Sentry. While our issues feed seems under control, alerts aren’t popping off, and our releases are all healthy, our experience has taught us the undeniable value of taking a proactive approach to unseen customer-impacting issues.

Stopping in Style: 9 Unique Designs for Website Maintenance Pages

We’ve already demonstrated how to maintain a fresh and functional website. Now, let’s explore some examples of creative maintenance pages! Nothing brings a good scrolling session to a halt quite like stumbling upon a website maintenance page. While maintenance pages can be annoying interruptions, they can also serve as attractive temporary visuals for sites undergoing updates. Many brands even elevate these pages into imaginative and artistic displays.