The latest News and Information on Monitoring for Websites, Applications, APIs, Infrastructure, and other technologies.
For this Tech Tip, we’re going to look at more ways you can integrate Catchpoint Alerts into your existing tool ecosystem (check out our recent video on integrating with Slack!). In this new, distributed workforce, employees are using more SaaS tools than ever. It’s important to identify how consolidating data can benefit key workflows – in this case, the ones for your IT support team.
Elastic solutions solve many different business challenges from powering search bars to creating observable systems to detecting and responding to threats. And with the amount of capabilities each offers, learning how to maximize the power of our solutions for enterprise search, observability, and security is critical to realizing Elastic's full value. But finding the time to build new skills can be challenging.
Syslog is a popular standard for centralizing and formatting log data generated by network devices. It provides a standardized way of generating and collecting log information, such as program errors, notices, warnings, status messages, and so on. Almost all Unix-like operating systems, such as those based on Linux or BSD kernels, use a Syslog daemon that is responsible for collecting log information and storing it.
In this article, we are going to see how we can integrate Google Cloud with Grafana. We will integrate Google Cloud SQL with Grafana and plot the metrics on Grafana. We will also look at how we can use Google Stackdriver as the data source in Grafana to expose the metrics of Google Cloud VM’s and platforms. To use Grafana immediately, we will be using Hosted Grafana by MetricFire.
Both Graphite and InfluxDB are time-series monitoring data platforms, both of which have high levels of adoption throughout many industries. Both of them are suitable for enterprise use, are scalable, and are stable. That being said, there are some benefits and drawbacks to each. While InfluxDB has many benefits, many developers still prefer Graphite due to its large community, stability, and reliability.
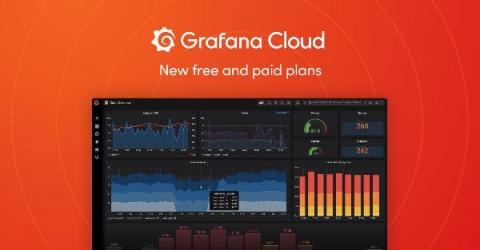
Oftentimes users of open source are told to go download it and figure it out… or pay for a managed solution in the cloud. So the typical choice is free and do-it-yourself or expensive and easy. With our new changes to Grafana Cloud, we are making it both free and easy to have a real, composable observability solution.
2020 is finally over and all of us are hopeful of a return to a sense of normalcy in 2021. At LogicMonitor, we came back re-energized from a healthy year-end break and are putting the finishing touches on our product roadmap for this year. This is a great opportunity to look back on what we accomplished in 2020 despite all of the challenges we faced.
So you’ve now finally finished putting all the pieces together – transitioned to Azure, deployed resources, deployed applications, got familiar with Azure Monitor and set up all the monitoring. You’re now collecting all the monitoring, application performance and security data for your Azure resources in Log Analytics workspaces, ready for analysis. (Head over to our Azure Monitor Learning Path if you're still figuring out how to do all that.) But is only the collection enough?