Operations | Monitoring | ITSM | DevOps | Cloud

The latest News and Information on Monitoring for Websites, Applications, APIs, Infrastructure, and other technologies.

Adapting to The New Normal in IT Operations

The waves of change are certainly upon us and businesses are being forced to adapt at a record pace. Current world events have caused a jarring shift in all aspects of our lives, accelerating major changes in how we live and work. An unprecedented number of people are now working from home. Those of us working in IT Operations are no exception. Many companies are implementing a Distributed IT Operations Center (D-NOC) approach to address this new reality.

Monitor Apache Flink with Datadog

Apache Flink is an open source framework, written in Java and Scala, for stateful processing of real-time and batch data streams. Flink offers robust libraries and layered APIs for building scalable, event-driven applications for data analytics, data processing, and more. You can run Flink as a standalone cluster or use infrastructure management technologies such as Mesos and Kubernetes.

Investing In Our Partnership with AWS

Even with a complete understanding of the benefits that come with running a hybrid environment, companies are still challenged with digital transformation best practices: what to move, when to move it, what’s being spent, how it’s performing, and what’s being overutilized and underutilized. This is why Amazon Web Services (AWS) is one of the most strategic partners in LogicMonitor’s ecosystem.

Top 10 Reasons Why NMS is A Must Have

Nothing’s worse than getting a call from the users that the network is down. Too often, IT lacks the visibility they need to get before performance issues arise, meaning you’re in the dark until a user or customer calls to complain. Once an outage happens, the clock is ticking. And the more time you take to understand and resolve the issue, the more it costs you: in terms of customer dissatisfaction, and also staff time & lost productivity.

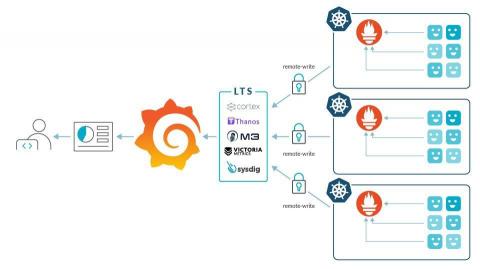
Challenges using Prometheus at scale

This article will cover the most common challenges you might find when trying to use Prometheus at scale. Prometheus is one of the foundations of the cloud-native environment. It has become the de-facto standard for visibility in Kubernetes environments, creating a new category called Prometheus monitoring. The Prometheus journey is usually tied to the Kubernetes journey and the different development stages, from proof of concept to production.

Tutorial: Shipping Docker Metrics to Logz.io

Docker is an essential bridge in modern DevOps. Despite Kubernetes overtaking Docker on orchestrating containers, the Docker container itself remains the standard and likely will for the foreseeable future. We developed the Docker Metrics collector to operate as its own container that will run Metricbeat using the modules you are running in real time. Now, in addition to the Docker module, we are now releasing an AWS module for operations in the cloud.

Challenges with Implementing SLOs

A few months ago, Honeycomb released our SLO — Service Level Objective — feature to the world. We’ve written before about how to use it and some of the use scenarios. Today, I’d like to say a little more about how the feature has evolved, and what we did in the process of creating it. (Some of these notes are based on my talk, “Pitfalls in Measuring SLOs;” you can find the slides to that talk here, or view the video on our Honeycomb Talks page).

Elastic APM adopts W3C TraceContext

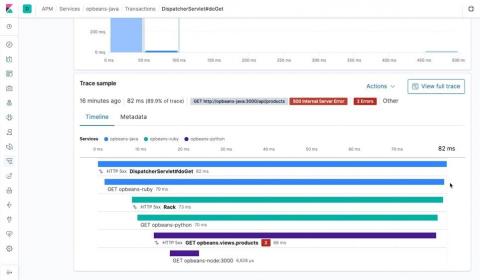
Distributed tracing remains one of the most important features of any tracing system. Nearly a year ago, we announced Elastic APM distributed tracing, let’s take a look at how this useful feature works behind the scenes. Over the past few years, many applications have adopted microservice architecture. Each of the services in a microservice architecture can have their own instrumentation to provide observability into the service.