Operations | Monitoring | ITSM | DevOps | Cloud

The latest News and Information on Monitoring for Websites, Applications, APIs, Infrastructure, and other technologies.

Foundation first: Why building a resilient IT infrastructure is your path to AI-readiness

Strategically ready, operationally unsure. That's how 42% of organizations describe their own AI preparedness when it comes to strategy versus infrastructure, data, risk, and talent, according to Deloitte's State of AI in the Enterprise 2026 report. As AI adoption accelerates, organizations now face the mounting pressure from the board to move past pilots and show AI delivering measurable business outcomes.

Cribl On Your Coffee Break Episode 17 - Notebooks

Whether you call them runbooks, response guides, or just notebooks, today on Cribl on your coffee break, we are looking at Cribl’s implementation, which lets you document your notes, queries, and discoveries as you make them, and then re-run those same processes later to troubleshoot similar issues in the future with less toil. By the time the month is over, you will have a pretty good idea of what Cribl can do, and how to do it. You’ll also have consumed more caffeinated beverages than is strictly appropriate...

When users don't click thumbs up: Inferring agent feedback from Datadog telemetry

Collecting high-quality user feedback on agents, like from thumbs-up or thumbs-down buttons, is an important part of agent development. User feedback is needed for everything from basic gut checks on whether your agents are behaving well to planning and creating robust eval sets. It’s a critical part of Datadog’s Agent Observability, which provides explicit end-user feedback features for collecting and analyzing it.

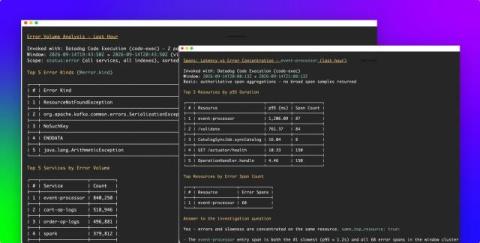
Cut AI agent cost and improve accuracy with Code Execution in the Datadog MCP Server

Observability investigations rarely follow a straight line. A latency question might cause an AI agent to start with a metric, pivot into traces, compare a deployment window, and finish by reducing thousands of logs to a few patterns. Each individual query is easy, but propagating context throughout an entire investigation can be tricky and expensive.

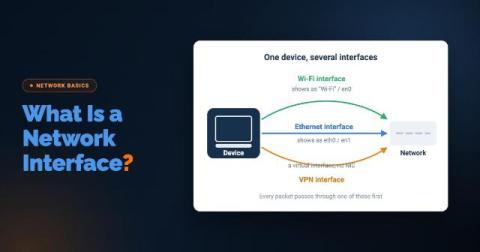
What Is a Network Interface (and Why Your Monitoring Tool Should Care)

A user opens a ticket: "The Internet is slow." IT checks the network. Bandwidth looks fine, no outages, no alerts firing. They check with the ISP, but nothing on their end either. Everything upstream checks out, and yet the user is still stuck watching a spinning wheel. What rarely gets checked is the one component sitting closest to the problem: the machine's own network interface.

Distributed Tracing Is Now in Beta for Ruby, PHP, and Python

A request comes in, enqueues a job, and returns. Twenty seconds later the job runs, and it’s slow. You have a trace of the request and a trace of the job, and nothing joining them. Time Detective has always helped you reconstruct what happened. Now we join it up for you, across applications, services, background jobs and infrastructure, even when they’re built in different languages.