Operations | Monitoring | ITSM | DevOps | Cloud

The latest News and Information on Monitoring for Websites, Applications, APIs, Infrastructure, and other technologies.

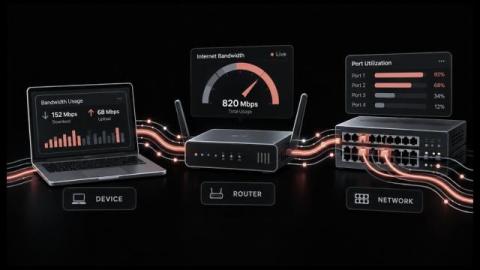
How to Check Bandwidth Usage Across Your Network

Most bandwidth problems get investigated after the complaints arrive, and by then the traffic that caused them has moved on. The numbers you need sit in several places at once. A laptop knows its own traffic. The router knows what leaves for the internet, and only the switches see how much network bandwidth moves inside the building. Checking bandwidth usage at the right layer saves hours of guessing. Most of the methods ship with hardware you already own.

What Is AgentIQ? Inside meshIQ's In-Flow Governance Control Plane for AI Agents

Enterprises are running AI agents nobody has counted, holding credentials nobody reviewed, taking actions nobody can audit. AgentIQ governs what agents are allowed to do at the moment of action—inside the execution flow—not after the fact through a gateway watching from outside.

Using TypeSafe's Jev for evals in Datadog Agent Observability

TypeSafe AI released Jev in September 2026 to do one thing: make decisions. Give it a state (a string or a JSON object) plus a set of typed questions, and it returns typed answers with probabilities. It never explains itself, and that constraint is the whole idea. Evaluation pipelines have spent the last two years asking text generators for yes/no verdicts, wrapping the reply in a JSON schema, and paying generation prices for what amounts to a single bit.

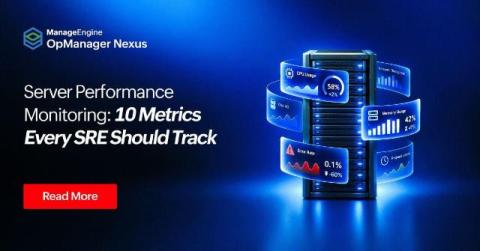
Server Performance Monitoring: 10 Metrics Every SRE Should Track

How do you know a server is about to cause problems before it actually does? You track the right metrics. Not all of them, just the leading ones that consistently surface performance issues before they worsen into outages. This guide breaks down the 10 server performance monitoring metrics every SRE should have on their radar.

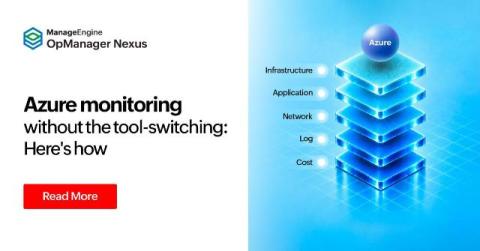
Fragmented Azure visibility? One Azure monitoring tool that tracks every layer

Most Azure monitoring setups look the same: Azure Monitor for metrics, Application Insights for apps, Log Analytics for logs, a separate tool for network, and another for cost. Each works in isolation. None of them talk to each other when something breaks. The Azure monitoring tool in ManageEngine OpManager Nexus consolidates infrastructure, application, network, log, and cost visibility data into a single console.

The human we find in our machines

There is a peculiar moment that happens when talking to AI. You ask it to rewrite an email, it does a good job, and you type, "Thanks!" Then, almost without thinking, you add, "Sorry, one more thing." It is software. It cannot be kept waiting, interrupted, or offended. Still, somehow, you have developed the manners. Then the questions get a little more personal.

S/4HANA Migration Monitoring: A Practitioner's Guide

Effective S/4HANA migration monitoring closes the operational gaps that quietly undo complex SAP transitions. Avantra eliminates the seams between phases where visibility typically disappears exactly when it matters most: the shift from baseline to cutover, the blind spot inside a parallel run, and the rushed handoff from legacy tools to Cloud ALM. This guide walks through every phase of migration monitoring in order, with a checklist you can adapt to your own project.

Vulnerability Fatigue: When Discovery Outpaces Remediation Capacity

Recent findings from Anthropic’s Project Glasswing offer a useful indication of where vulnerability discovery may be heading. Anthropic reported that it and its partners had used Claude Mythos Preview to identify more than 10,000 high- or critical-severity vulnerabilities across the software they reviewed. More significantly, Anthropic reported that the bottleneck had shifted from finding vulnerabilities to having the capacity to verify, disclose, and patch them.

Inputs Demystified - Connect Anything with the Input Wizard Webinar

Getting logs into Graylog should not require a PhD in syslog. Part of the Getting the Most out of Graylog Open series, this session educates Open users on the full Inputs framework in Open, what input types are available, when to use each, and how to use the Input Wizard to get new sources connected faster. Open users need to be on the latest version of Graylog. We also cover the revamped Inputs page and how to validate that your data is arriving clean.