Operations | Monitoring | ITSM | DevOps | Cloud

The latest News and Information on Monitoring for Websites, Applications, APIs, Infrastructure, and other technologies.

How does fragmented telemetry affect an AI system's ability to reason what's really happening?

Fragmented telemetry limits what AI can understand. When logs, metrics, and traces remain siloed, AI sees individual signals instead of the full story. That can lead to incorrect conclusions and unexpected outcomes. This is where AI observability matters. Virtana connects telemetry across the stack, giving AI the context it needs to correlate signals, understand dependencies, and identify what is really happening.
Cribl On Your Coffee Break Episode 19 - A Cribl Grab bag: Guard, API/SDK, Insights, and FinOps

In our penultimate episode of the series we try to hit all the things that didn’t fit anywhere else - Cribl Guard, the API/SDK, Insights, and the FinOps center. By the time the month is over, you will have a pretty good idea of what Cribl can do, and how to do it. You’ll also have consumed more caffeinated beverages than is strictly appropriate...

Introducing Selector Foundry: Agentic NetOps

Network operations teams have heard plenty about AI this year. Most of it answers the alert in front of it, then hands the rest of the incident back to an engineer. Someone still has to correlate the evidence, find the cause, prepare the fix, and prove it held. This week, we announced Selector Foundry, the agentic NetOps solution built into the Selector platform. Foundry adds a team of specialized AI agents on top of the full-stack observability and AIOps foundation our customers already run.

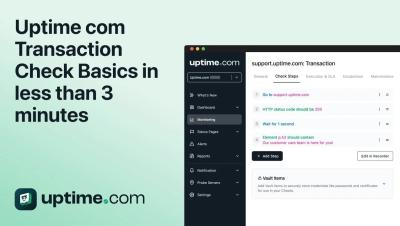
Transaction Check Basics in less than 3 minutes

In this video, we explore the basics of Transaction Checks on Uptime.com, an advanced multi-step monitoring tool for website elements. Learn how to create customized scripts to mimic user actions such as visiting a site, filling out forms, and clicking buttons. We walk through a step-by-step guide on setting up a Transaction Check to monitor a login process, including navigating to a URL, validating HTTP status codes, and using browser developer tools to configure field entries. Discover different monitoring intervals and tips for organizing your checks with tags and location settings.

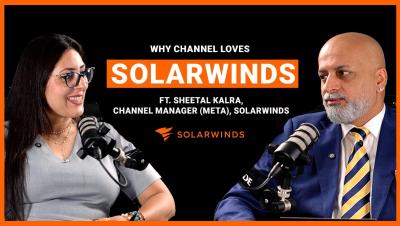
The Human Side of Innovation: Sheetal Kalra on Trust, Simplicity, and SolarWinds in Africa

"Channel is the heartbeat of any vendor conversation...if your product is not good, the channel is not going to be doing the miracle." In this episode of SolarWinds World Tour Conversations, we sit down with Sheetal Kalra, Regional Channel Manager for META, to discuss why a strong channel ecosystem is essential for bringing in strong customers. We explore the technology-driven nature of channel sales, the 2026 modifications to simplify the Partner Program, and how partners are successfully navigating network and observability challenges for their clients.

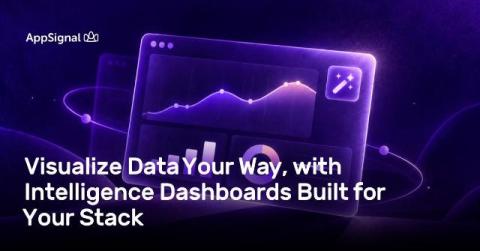
Visualize Data Your Way, with Intelligence Dashboards Built for Your Stack

When something goes wrong in production, you do not want to spend the first five minutes rearranging charts. You want the error rate, throughput, queue depth, memory, and view metrics that show when customers are having issues while using your app.

What if your agent's hallucinations had a budget? How to start using SLOs for agent behavior

At Grafana Labs, observability is what we do. So as we started building AI agents, we naturally reached for the same instincts we bring to every system: measure it, set targets, and make reliability something you can reason about instead of hope for. That instinct led us somewhere unexpectedly useful. It turns out one of the oldest ideas in reliability engineering, the error budget, maps beautifully onto one of the newest problems in software: how do you know if an AI agent is actually any good?

EU data residency for Hosted OpenSearch on Logit.io

EU buyers asking for Hosted OpenSearch with data residency usually mean something precise: indexes and cluster storage should land in a European data centre that lines up with GDPR expectations and the geography named in the DPA — not a US default that security later has to unwind. On Logit.io that choice is an account-level data storage region, not a free toggle on every stack. Get the first stack right and every later OpenSearch or log stack in that account follows.

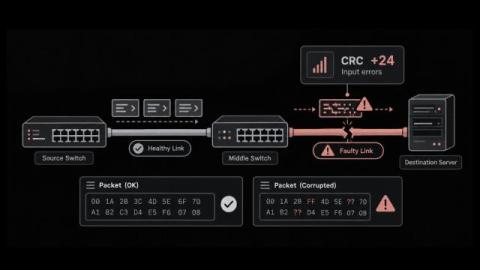
What is a CRC Error and How to Find the Faulty Link Before It Slows the Business

Why does a switch port look healthy on every dashboard while people on that floor keep reporting dropped calls and slow file transfers? Often the cause is CRC errors, a port counter that most dashboards do not show by default. Each CRC error means a unit of data arrived damaged and the switch discarded it. Put simply, a CRC error tells you the receiving device noticed the data changed somewhere in transit.