Operations | Monitoring | ITSM | DevOps | Cloud

The Pragmatic Buyer's Guide to AIOps Platforms

It’s been said hundreds of times: in the digital era, customers tolerate no downtime. IT operations teams must keep systems running 24x7x365, as the price of downtime is steep. According to Gartner, in 2014, organizations lost $5,600 per minute of downtime, which worked out to well over $300,000 per hour. Today, it’s likely higher, as organizations increasingly rely on technology to power revenue-generating business services.
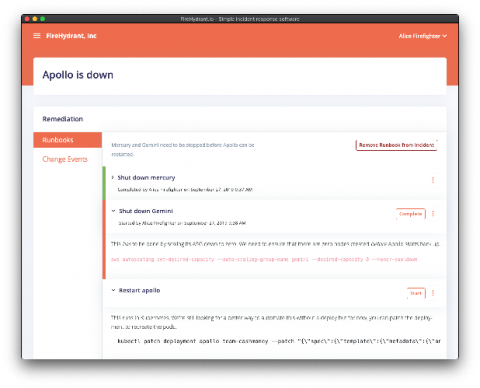

Announcing Runbooks

Since the beginning, we’ve wanted to make it faster, easier, and even a joy to respond to incidents. We’ve had the typical components of incident response for a while, but orchestrating them together was a manual task by our users. Today we’re marrying together all the features already available in our incident response tool into our newest release: Runbooks.

Integrating Time Series Correlation to Accelerate Root Cause Analysis

In any platform of sufficient complexity, multiple anomalies are likely to occur. For many organizations, NOC operators triage multiple anomalies based on their severity. There are internal, non-customer-facing issues that might affect only a small part of your workforce and one-time issues that affect only a small number of customers. Both of the issues get ticketed and sent to low-level support.

Real-Time Analytics for Time Series

Let’s start with simple definitions. Time series data is largely what it sounds like – a stream of numerical data representing events that happen in sequence. One can analyze this data for any number of use cases, but here we will be focusing on two: forecasting and anomaly detection. First, you can use time series data to extrapolate the future.

Making the Most of PagerDuty + Datadog

For your team to effectively respond to incidents, you need a shared, unambiguous incident definition so you can recognize when an incident has occurred and assign the appropriate severity. Definitions of an incident differ across teams, but whatever definition you use, identifying and monitoring key service level indicators (SLIs) can help you understand when your service is operating normally—and when its performance has degraded to the point where you need to trigger an incident.

Adtech Leader Natural Intelligence Now Resolving Glitches in Minutes Rather than Days

Natural Intelligence runs comparison websites that generate millions in ad traffic. A glitch could easily cost the company thousands in ad revenue. VP R&D Lior Schachter shares the difference Anodot’s real-time analytics, with machine learning anomaly detection, has made across the company.