Operations | Monitoring | ITSM | DevOps | Cloud

The latest News and Information on DevOps, CI/CD, Automation and related technologies.

Data-Driven Software Development: How To Make Strategic Dev Decisions

A fundamental requirement for building a profitable product is finding ways to reduce costs and improve efficiency. When you’re operating in the cloud, it’s almost impossible to gain this insight without data. This is where data-driven software development comes in. Data-driven development is a software engineering approach that relies on data to guide the development process.

Preparing your team for continuous deployment

A key goal for any DevOps team is to shorten the software development cycle and provide continuous delivery of high-quality software. Instead of continuing to the next logical goal, continuous deployment, most companies stop here. Developed code reaches the testing phase automatically, then, successful testing triggers a manual acceptance step. Only then is the application deployed into production.

Unit testing vs integration testing

Software is one of the most complex tools invented for practical use. One misplaced character can break an entire application. So, careful testing is an essential requirement before publishing any code. In this article, you will learn about two fundamental types of software testing, unit testing and integration testing, and how your team can implement them in your CI/CD pipelines to validate your code quickly and deliver new features to your users with confidence.

Superfast Troubleshooting of Network User Performance Issues

In our first edition of our Work From Anywhere series, we look at the value of troubleshooting end-user hardware and application issues. Exploring the granular detail that the solution provides, we look at how understanding information around the end-users hardware can help reduce mean-time-to-resolution and increasing productivity of service/support desk teams.

TL;DR InfluxDB Tech Tips - Visualizing Uptime with Flux deadman() Function in InfluxDB Dashboards

A common DevOps use case involves alerting when hosts stop reporting metrics, aka a deadman alert. This can be done using the monitor.deadman() Flux function. One can easily create a deadman (or threshold) check in the InfluxDB UI Alerts section or craft a custom task to alert as well. Check out InfluxDB’s Checks and Notifications system post for more details. It’s also possible to use the monitor.deadman() function directly in a dashboard cell.

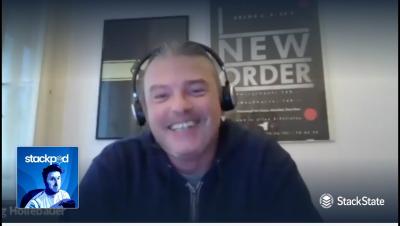
Why observability is the way to go w/ Georg Höllebauer (APA-Tech) | The StackPod EP #2

Welcome to the second episode of the StackPod! For the second episode, we invited Georg Höllebauer. Georg is an enterprise metrics architect at APA-Tech. APA-Tech is responsible for all IT services within the Austrian Press Agency - Austria's national and largest press agency - and other customers.