Express Demo: SquaredUp Azure Edition
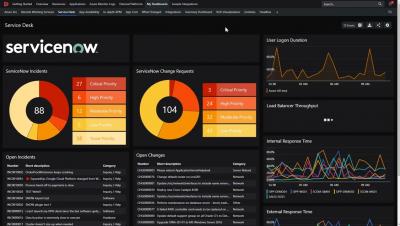
Watch our 80 second overview video to see the awesome dashboarding power of SquaredUp Azure Edition.


The latest News and Information on Monitoring for Websites, Applications, APIs, Infrastructure, and other technologies.
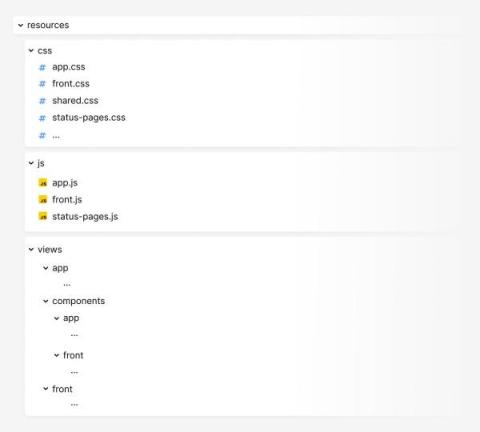
We are currently rebuilding the Oh Dear website and application frontend. The goal is to go next level in aesthetics and user experience. The Oh Dear redesign will be launched later this year. In this post, you'll read more about the project setup and tools used. This is the first blog post of a series that will share progress and the knowledge gained along the way.
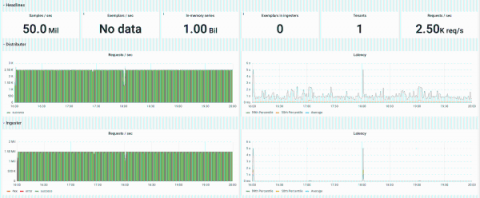
Last week, we announced our new open source TSDB, Grafana Mimir, which lets you scale your metrics monitoring to 1 billion active series and beyond. The announcement was greeted with a lot of excitement and interest – and some questions too. Namely: Really, 1 billion? Yes, really!
Shoreline is an incident response automation service that enables DevOps engineers and site reliability engineers (SREs) to quickly debug and remediate issues at scale and develop automated routines for incident management. Using Shoreline’s proprietary Op language, customers can run debug commands across all their hosts simultaneously and then deploy custom scripts via Actions to trigger automated remediations.
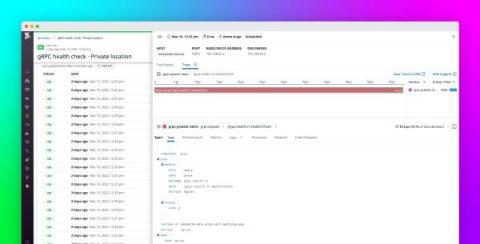
gRPC is an open source Remote Procedure Call (RPC) framework developed by Google and released in 2016. Although gRPC is still relatively new, large organizations are adopting it in increasing numbers to build APIs to connect complex microservice meshes that use disparate languages and frameworks. gRPC-based APIs can process requests up to seven times faster than REST APIs, and they also allow customers to easily implement SSL authentication, load balancing, and tracing via plug-in libraries.
Dear Acronymically, I'll try to answer without using a single (new) acronym! First things first—"PRO" refers to our Pro plan, rather than being an acronym in and of itself. Honeycomb Pro is our cost-effective offering for professionals like you who are running a few production workloads! And we're hoping that folks will get even more benefit now that they have access to our SLO feature!