Operations | Monitoring | ITSM | DevOps | Cloud

The latest News and Information on Monitoring for Websites, Applications, APIs, Infrastructure, and other technologies.

How to improve the customer service experience through status pages

With the 2021 holiday season right around the corner and the COVID-19 pandemic still prevalent, businesses are being conducted online now more than ever. The holiday rush also comes with incidents like websites going down, slow load times, and even possible hacking attempts. While planning to tackle the sudden increase in website traffic during the festive season, businesses must have an incident response plan in place to handle unexpected outages and the consequent surge in customer inquiries.

VirtualMetric's Heatmaps

Within just a couple of seconds, you can see your entire server infrastructure’s status in a visual format in VirtualMetric's Heatmaps. All hardware and performance-related issues will be highlighted in the form of visual cues in neatly organized heat maps. The information is also updated in real-time, thus allowing you to catch errors before they pass the threshold. 👉 Flexible and scalable option VirtualMetric, being cloud-based, can quickly adapt to changing server requirements and infrastructure setups.

k6 introduces browser automation and Prometheus support in k6 OSS

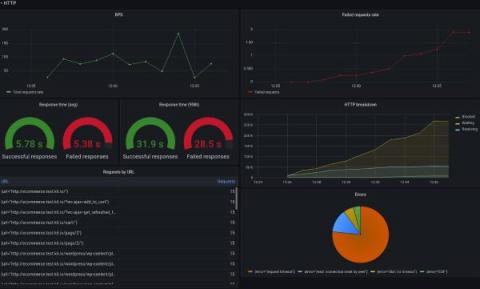
While there is a lot of focus on the three pillars of observability to provide insight into application performance in production, load testing is the other side of the observability story. By using the open source load testing tool k6 — which Grafana Labs acquired earlier this year — developers can simulate real-world traffic to test the reliability and performance of software changes and new features, not to mention flag performance issues before impacting end users.

This Month in Datadog: November 2021 (Episode 6)

Datadog is constantly elevating the approach to cloud monitoring and security. This Month in Datadog updates you on our newest product features, announcements, resources, and events. This month we put the Spotlight on Network Device Monitoring, along with highlighting the many announcements and guest presentations from Dash.

Monitoring Elastic Enterprise Search performance using Elastic APM

Elastic APM is a free, open and powerful observability tool that provides intelligence into application performance for a myriad of production applications (e.g., throughput, error rates, latency, resource usage, transaction traces). You can now enable Elastic APM integration to gain deep insight into the performance behaviors of your Elastic Enterprise Search deployment!

Announcing the General Availability of Splunk RUM Custom Events

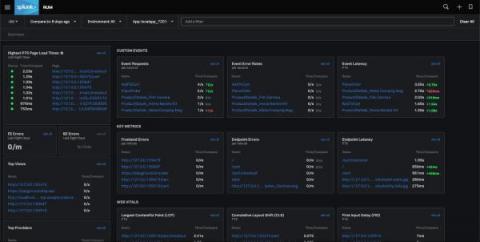
With a 70% increase in internet usage, and digital teams adopting cloud-native technologies at a rapid rate, the importance of measuring customer experience on digital properties is not just a technical problem, but a business imperative. Frontend developers and SREs use Real User Monitoring (RUM) to understand critical components of their end-user experience, like how quickly users see content, when a page becomes interactive, and a page's visual stability.