The latest News and Information on Monitoring for Websites, Applications, APIs, Infrastructure, and other technologies.
Imagine, you are developing Java software and suddenly you encounter an error? Where could you have possibly gone wrong? There are many types of errors that you will encounter while developing Java software, but most are avoidable. Some errors are minor lapses when writing codes but that is very much mendable. If you have an error monitoring tool such as Stackify Retrace, you can write codes with ease.
On Wednesday 17th March, globally used DNS provider Network Solutions experienced the dreaded downtime we all hope to avoid. Starting at 4am Eastern time and continuing through to Thursday 18th with still no resolution, it’s affected thousands of people across the world. Network Solutions are the 4th biggest domain registrar in the world, with nearly 7 million users worldwide.
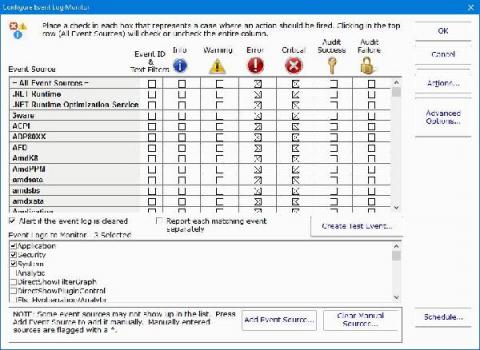
Did you know that you could configure PA Server Monitor’s Event Log Monitor feature to monitor one or more of your event logs? The event logs can include standard application, security, and system logs, as well as any custom event logs you want to monitor. With our server monitoring software, you have complete control and flexibility over the types of events you want to monitor.
If you are a .NET developer, monitoring runtime metrics can help you troubleshoot bugs and detect resource inefficiencies in your applications. With Datadog, you can easily collect, visualize, and alert on key .NET runtime metrics, including exceptions, garbage collection statistics, thread count, and more. We have fully integrated .NET runtime metrics into Datadog APM so that you can easily view them alongside your distributed traces, logs, and other telemetry.
Kamon APM wakes up today with a new home page for all your observability data: the all-new Kamon APM Service Map! The Service Map shows a real-time representation of all your microservices and the dependencies between them, combined with health status and easy access to the most important bits of data from your entire infrastructure.
Setting up a proper monitoring overview over your application’s performance is a complex task. Normally, you’d first need to figure out what you need to monitor, then instrument your code, and finally make sense of all the data that has been emitted. However, with a few things set in place, and an APM that natively supports Ruby, it’s easier than ever to take this step. In this post, we’ll show you how you can do it too.
This Logz.io Infrastructure Monitoring tutorial will cover how to get started with our latest product, our new Prometheus-as-a-Service metrics solution that’s based on Prometheus. Engineers monitor metrics to understand CPU and memory utilization for infrastructure, duration and serverless execution, or for network traffic. For more advanced metrics monitoring operations, teams can send custom metrics to monitor signals like the number of active users.
When a website is compromised to steal credit card information, a link to a malicious JavaScript file is normally inserted into the website’s code. This file then loads what is called the skimmer, the code responsible for skimming personal and financial details from customers.
Energy efficiency is a term often used to describe appliances or light bulbs. But when it comes to business, making sure your sales team — and customers — are being efficient with their personal energy is a big key to success. That was a major lesson learned by Utilita, the U.K.’s first and only specialist Smart Pay As You Go Energy supplier.