Operations | Monitoring | ITSM | DevOps | Cloud

The latest News and Information on Monitoring for Websites, Applications, APIs, Infrastructure, and other technologies.

The recovery playbook every IT team needs to get ahead of downtime

Most downtime doesn't come from problems your team can't solve. It comes from problems they've already solved sitting in a runbook or a text file, waiting for someone to run the fix manually. The fix is documented, and the steps are proven, yet the recovery still takes 40 minutes because a human has to log in and type it out. Workflow automation exists specifically to close that gap: The fix runs the moment the alert is triggered, not when someone sees it.


Elastic Introduces Elastic nightshift AI SRE to Investigate with the Full Context Others Can't Afford to Keep

The AI SRE uses complete context from across the entire stack to continuously detect issues and learn from every incident, delivering evidence-backed answers engineers can trust.

Sentry JavaScript SDK v11 adds tracing for all JS platforms

This post is about a recent change to the Sentry JavaScript SDKs. If you don’t use Sentry with JavaScript, it may still be useful as a look at how we made the change and why. In the Sentry JavaScript SDK v11, we rebuilt how our tracing integrations work. While we still support the OpenTelemetry standard (described in more detail below), we now instrument your dependencies with a code transformer instead of using the OpenTelemetry instrumentation classes as we did in previous versions.

Grafana Tempo: Redaction by query & TraceQL filtering in trace-by-ID v2 (Oct 2026 Community Call)

Trace redaction permanently removes sensitive data from your traces, for when something like an API key ends up in a span attribute. Tempo 3.0 could do it, but only from a list of trace IDs, so you had to go find every affected trace first. In Tempo 3.1 you can hand it a TraceQL query instead. Separately, trace-by-ID got a filter. You normally ask for a trace and get all of it. Now you can pass a TraceQL query and get back only the spans that match.

Landing on the Moon with Grafana and Thermal Engineering | Grafana Everywhere

In honor of World Space Week, we're spotlighting Jackson Sweeney's story and his role in Blue Ghost Mission 1. As a Thermal Engineer at Firefly Aerospace, he used Grafana to ensure that the spacecraft maintained the right temperature throughout the mission... and receive a Golden Grot Award for his use case. Behind every successful moonshot are people solving one hard problem after another. For engineers like Jackson, that means turning an extraordinary ambition into thousands of practical decisions.

Fixing 3 issues with one distributed trace

Use Sentry tracing to investigate three different problems in one shopping flow: an N+1 query, an expired promo-code warning, and a checkout exception. The entire shopping flow happens through the agent conversation on Empower Plant’s homepage: a search for plants under $200, adding one of each to the cart, starting checkout, applying SAVE20, then attempting to place the order. The trace connects that flow to repeated database queries and an N+1 issue, a warning that SAVE20 has expired, and a checkout exception with its inventory-validation stack trace.

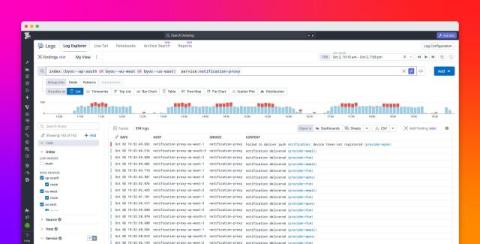
Unify data across Datadog BYOC with cross-cluster queries for teams and AI agents

Organizations may need to keep data in specific regions or infrastructure they control, whether because of data residency requirements, internal policies, or transfer costs. Datadog Bring Your Own Cloud (BYOC) extends the Datadog platform into those environments. Each BYOC deployment runs as a Kubernetes cluster with its own object storage, keeping data close to its source.

First CloudWatch Logs on Logit.io

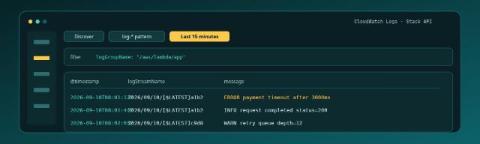
CloudWatch already holds the lines from your Lambda, ECS task, or unified agent. The first useful win on Logit.io is not a migration spreadsheet. It is one Log Group, the documented Lambda shipper posting to this stack's API, and rows in OpenSearch Dashboards Discover that show logGroupName, logStreamName, and message. If you are still proving that a Logs stack can accept anything at all, start with First Logs on Logit.io; this post assumes CloudWatch is the source and the Stack API is the pipe. Contents.

What Is RMM (Remote Monitoring and Management)?

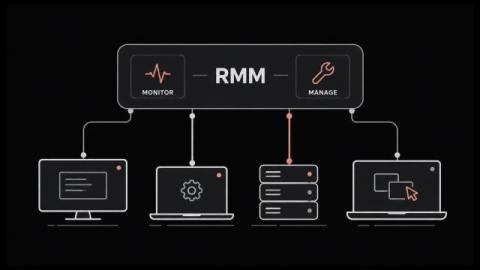
RMM lets one small team look after thousands of machines nobody will ever physically touch. It grew up inside managed service providers. The whole category runs on agent-based monitoring, which means a small program sits on every endpoint and phones home on a schedule. That agent is also why attackers have taken such an interest lately. In this blog, you'll see: By the end you'll know what the category covers and where it stops. RMM stands for remote monitoring and management.

SSL Handshake Guide Covering Each Step and the Fixes That Prevent Outages

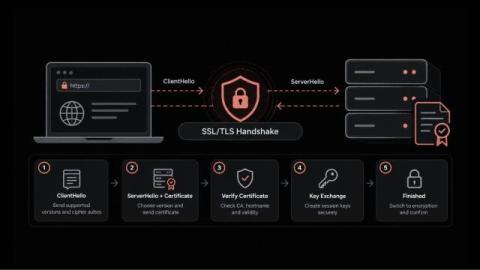
Why would a website that passes every uptime check still show customers a security warning? In most cases, the server is running and the network is healthy. The failure happens earlier, during the brief exchange in which the browser and the server agree on how to communicate securely. That moment is the SSL handshake. If it goes wrong, users get an error page while your dashboards stay green. Maybe a certificate expired; maybe a routine change left both sides on different protocol versions.