Operations | Monitoring | ITSM | DevOps | Cloud

The latest News and Information on Monitoring for Websites, Applications, APIs, Infrastructure, and other technologies.

How IT Consultants Can Save Time with Uptime.com

Today’s economy has created a new class of worker: the IT consultant. This lone warrior often manages multiple websites, responding to anything from outages to update requests and every code debug in between. If one can manage the never ending onslaught of servers, API calls and transactions these sites rely on each day, it’s a pretty decent living. The key is removing all the menial work that overwhelms and stifles productivity.


PHP Profiling: How to Find Slow Code

I use performance monitoring tools primarily to find slow and buggy code. At the start of development, I typically use the tools more for finding software bugs. Once the codebase is at a relatively stable phase, then I shift my focus toward finding less performant code. Which is why I turn to tools like Retrace to help with profiling for better performance.

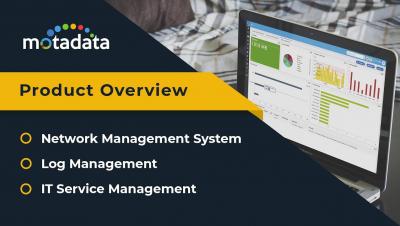
Motadata - Network Management System | Log Management | IT Service Management

Motadata is strongly positioned to enable Telco’s, Enterprise and Government sectors to streamline their IT operations with next-gen product suite which is pre-integrated yet modular, consisting of (1) Infrastructure Intelligence Platform (IIP) for #NetworkMonitoring (2) Data Analytics Platform (DAP) for #LogManagement & Flow Analytics and (3) ITServiceManagement Platform for IT Service Automation.

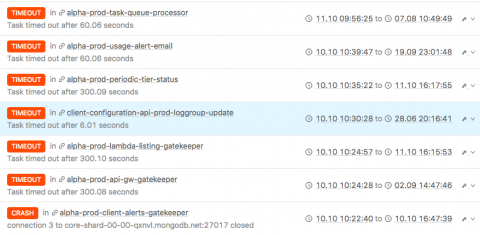
We can do better failure detection in serverless applications

Traditionally in white-box monitoring, error reporting has been achieved with third party libraries, that catch and communicate failures to external services and notify developers whenever a problem occurrs. I’m here to argue that for managed services this can be achieved with less effort, no agents and without performance overhead.

Introducing the Datadog Cluster Agent

As containers and orchestrators have surged in popularity, they have created highly dynamic environments with rapidly changing workloads—and the need for equally dynamic ways of monitoring them. After all, orchestration technologies like Kubernetes, DC/OS, and Swarm manage container workloads both at the node level and at the cluster level, which means that you need to gather insights from every layer to fully understand the state of your infrastructure.

4 Reasons Why Your Source Maps are Broken

Source maps are awesome. Namely, because they are used to display your original JavaScript while debugging, which is a lot easier to look at than minified production code. In a sense, source maps are the decoder ring to your secret (minified) code. However, they can be tricky to get working properly. If you’ve run into some trouble, the tips below will hopefully help you get everything in working order.

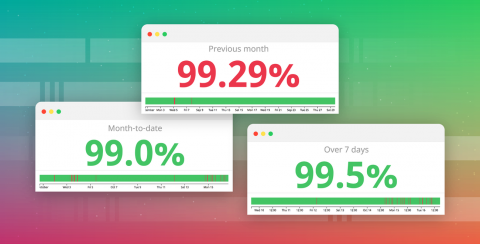
Track the status of your SLOs with the new monitor uptime widget

Service level objectives are an important tool for maintaining application performance, ensuring a consistent customer experience, and setting expectations about service performance for both internal and external users. We are very pleased to announce the availability of a new monitor uptime widget that makes it simple to monitor the status of your SLOs and communicate that status to your teams, executives, or external customers.

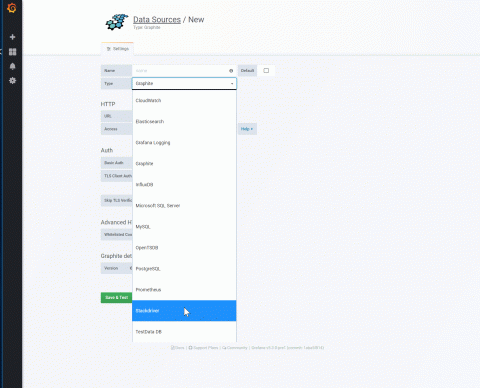
Introducing Stackdriver as a data source for Grafana

It is not uncommon to have multiple monitoring solutions for IT infrastructure these days as distributed architectures take hold for many enterprises. We often hear from Google Cloud Platform (GCP) customers that they use Stackdriver to monitor resources as well as Grafana and Prometheus for container monitoring. We’ve heard lots of requests from customers to be able to view Stackdriver data in Grafana effortlessly.