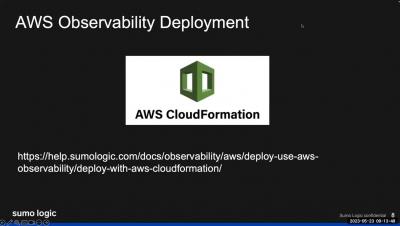
Sumo Logic Customer Brown Bag - Observability - Get Control - May 23rd 2023
In this session, Pawel covers Sumo Logic Observability Metrics and AWS Observability.


The latest News and Information on Observabilty for complex systems and related technologies.
Today we’re happy to announce our new open source, scalable logging solution, VictoriaLogs, which helps users and enterprises expand their current monitoring of applications into a more strategic ‘state of all systems’ enterprise-wide observability. Many existing logging solutions on the market today offer IT professionals a limited window into live operations of databases and clusters.
AWS Fargate is a serverless pay-as-you-go engine used for Amazon Elastic Container Service (ECS) to run Docker containers without having to manage servers or clusters. The goal of Fargate is to containerize your application and specify the OS, CPU and memory, networking, and IAM policies needed for launch. Additionally, AWS Fargate can be used with Elastic Kubernetes Service (EKS) in a similar manner.
At Honeycomb, we are all about observability. In the past, we have proposed observability-driven development as a way to maximize your observability and supercharge your development process. But I have a problem with the terminology, and it is: I don’t want observability to drive your development.
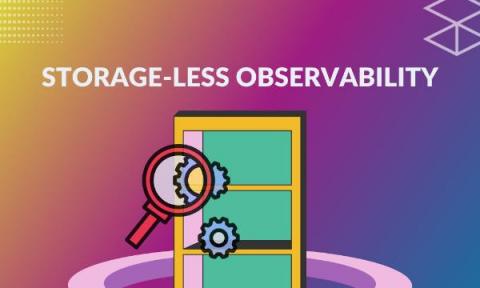
In today’s data-driven world, the need for comprehensive observability has never been greater. Organizations rely on observability to gain insights into their systems’ and applications’ performance, availability, and behavior. However, the traditional approach to observability, which involves ingesting, processing, and storing massive amounts of data, is becoming increasingly challenging and expensive.
Fintech companies operate in a complex technological and regulatory environment. They rely heavily on cloud-native technologies and microservices architectures to handle financial transactions and data, often at a massive scale. To maximize application reliability, fintech companies need full visibility into their software systems and applications. An agile monitoring solution like observability is crucial to improving performance and user experience.
Cribl has a unique position right in the middle of the observability market, giving us a distinct view of all things security, APM, and log analysis. Observability as a concept has exploded into specialized areas over the past two years, and making sense of the players and market forces, particularly in a difficult macro environment, can be tricky. Let’s break it down.
Code instrumentation is an essential practice in modern software development. Not only does it aid in debugging, it ultimately impacts the MTTR (Mean Time to Resolve) for software running in production. With changing software architectures and deployment patterns over the years, approaches to code instrumentation have also undergone a significant shift.