The latest News and Information on Observabilty for complex systems and related technologies.
Are you looking for a better way to troubleshoot, debug, and really see and understand what weird behavior is happening in production? Service-level objectives (SLOs) and observability can help you do all that—but they require collecting and storing the right data. If we’re naive with our telemetry strategy, we spend a lot of money on storing data without seeing adequate return on investment in the form of insights.
Observability and Monitoring are viewed by many as interchangeable terms. This is not the case. While they are interlinked, they are not interchangeable. There are actually very clear and defined differences between them. Monitoring is asking your system questions about its current state. Usually these are performance related, and there are many open source monitoring tools available. Many of those available are also specialized.
Graphical processing units, or GPUs, aren’t just for PC gaming. Today, GPUs are used to train neural networks, simulate computational fluid dynamics, mine Bitcoin, and process workloads in data centers. And they are at the heart of most high-performance computing systems, making the monitoring of GPU performance in today's data centers just as important as monitoring CPU performance.
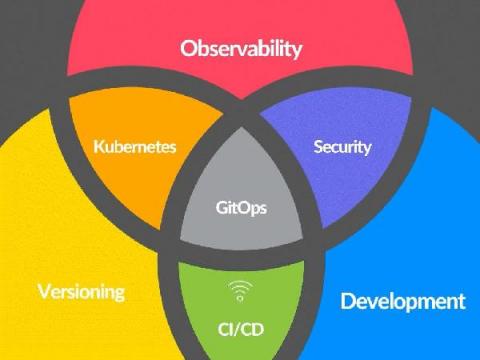
We can plausibly say the enterprise development market turned the tide on cloud-native development in 2020, as most net-new software and serious overhaul projects started moving toward microservices architectures, with Kubernetes as the preferred platform.
It’s easy to get started with Java and Honeycomb using OpenTelemetry. With Honeycomb being a big supporter of the OpenTelemetry initiative, all it takes is a few parameters to get your data in. In this post, I will walk through setting up a demo app with the OpenTelemetry Java agent and show how I was able to get rich details with little work by combining automatic instrumentation from the agent with custom instrumentation in the code.
Today, we are launching a new Grafana Labs product, Grafana Enterprise Logs. Powered by the Grafana Loki open source project for cloud native log aggregation, and built by the maintainers of the project, this offering is an exciting addition to our growing self-managed observability stack tailored for enterprises.
With an increasing number of organizations migrating their applications and workloads to containers, the ability to monitor and track container health and usage is more critical than ever. Many teams are already using the Metricbeat docker module to collect Docker container monitoring data so it can be stored and analyzed in Elasticsearch for further analysis. But what happens when users are using Amazon Elastic Container Service (Amazon ECS)? Can Metricbeat still be used to monitor Amazon ECS? Yes!