Operations | Monitoring | ITSM | DevOps | Cloud

Latest News

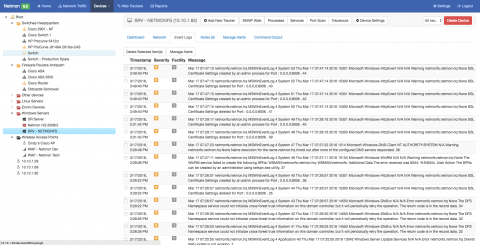
Configuring SYSLOG / Event Log on a Windows Device

Netmon’s complete Network Monitoring Solution can also be used as a centralized SYSLOG and Windows Event Log Server where you can quickly look through many Servers, Workstations or other Network devices’ SYSLOG and Event Log information without having to log into each individual device to see the same information.

Feature Spotlight: Transaction Check

Uptime’s transaction checks can continually monitor important functionality of your site. Specific steps within a Transaction Check can monitor nearly anything you have a test case for. So, this check is as good as the steps you configure for it. You can think of it as the first response or notification that a portion of critical infrastructure is down.

5 game-changing tips for automating your bug tracking in Jira Service Desk

Bug tracking is hard. Once more for your boss in the back. Bug tracking is hard! The support agent to developer handoff is a crucial yet an easily mishandled exchange. That’s bad news if you’re striving for low time-to-resolution targets and happy customers. Luckily, Atlassian and its app vendors provide an array of tools that can help you automate your bug resolution workflows to improve speed, consistency, and communication.

3 phases of Prometheus adoption.

How to ensure visibility into your next-generation Kubernetes environment. Having assisted hundreds of enterprises in developing a new visibility strategy as they move to Kubernetes, I’ve learned a few things about how organizations learn, evolve and adopt a new method of application observability. Open source is usually essential to developing this understanding.

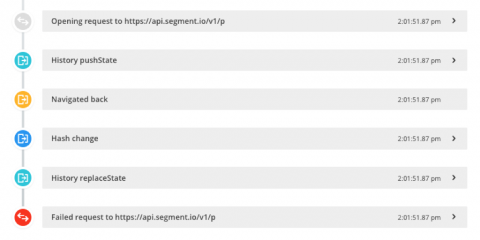
How to replicate user errors without the user with Breadcrumbs and Sessions

If you need to replicate a user error, you’ll know how difficult it can be to pinpoint the cause. Usually, you’d look at the stack trace or ask the user themselves. However, that’s a lot of guesswork, especially if the stack trace is obfuscated. We’ll show you how to replicate the error faster using Crash Reporting’s Breadcrumbs and the Real User Monitoring Sessions feature.

The Importance of Historical Log Data

Centralized log management lets you decide who can access log data without actually having access to the servers. You can also correlate data from different sources, such as the operating system, your applications, and the firewall. Another benefit is that user do not need to log in to hundreds of devices to find out what is happening. You can also use data normalization and enhancement rules to create value for people who might not be familiar with a specific log type.

Metrics At Scale: How to Scale and Manage Millions of Metrics (Part 2)

With businesses collecting millions of metrics, let’s look at how they can efficiently scale and deal with these amounts. As covered in the previous article (A Spike in Sales Is Not Always Good News), analyzing millions of metrics for changes may result in alert storms, notifying users about EVERY change, not just the most significant ones. To bring order to this situation, Anodot groups correlated anomalies together, in a unified alert.

6 Things You Need in an IT Incident Management Platform

Your incident management process is greatly impacted by the tools you have available. And technology is key when it comes to gaining visibility and obtaining contextual data. You need tools to send alerts when incidents arise, as well as track activity for compliance reporting purposes. Whether you’re in healthcare, information technology or work at a small MSP – you need a robust incident management platform that gives you results and helps mitigate MTTR.