Talon.One Optimizes Cloud Infrastructure Costs
With Aiven at the heart of its data platform, Talon.One enjoys significant cost efficiencies.


Can you believe we’re already halfway through 2023? Time flies when you’re busy innovating and having fun (yet somehow also seems so slow when you are waiting for your next vacation!!). At Cribl, we’ve been hard at work releasing wave after wave of incredible new features and capabilities across our entire product suite.
Health checks are an important factor when working with containerized applications in the cloud and are the source of truth for many applications in terms of their running status. In the context of AWS Elastic Container Service (ECS), health checks are a periodic probe to assess the functioning of containers. In this blog, we will explore how Lumigo, a troubleshooting platform built for microservices, can help provide insights into container crashes and failed health checks.
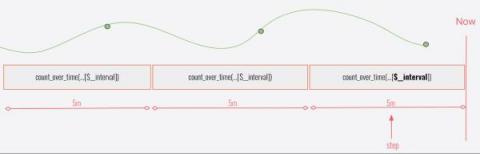
Today I want to talk about metric queries. More specifically, I want to talk about an important concept that is going to make your queries run faster, give you more accurate results, and make your Grafana Loki operators (like me) much happier. A metric query in Loki looks like this: And the part I want to talk about is that at the end. Now, if you’re like me and have a short attention span and are already bored — I understand.
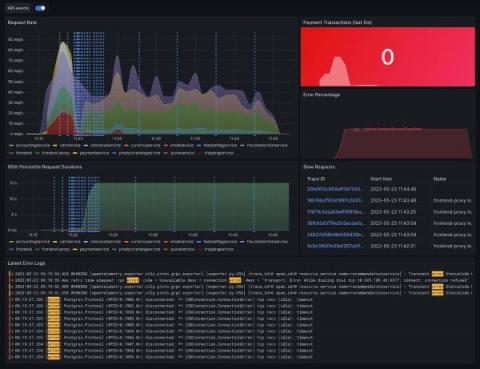
The Grafana Labs ecosystem is built on a range of different projects that incorporate logs, metrics, traces across load testing, and Kubernetes monitoring. I’ll assume you know all of that data (and more!) can be visualized in Grafana. What made my observability dream become reality, though, is how these systems can work together to help you effectively debug performance issues and operate your system with more confidence.
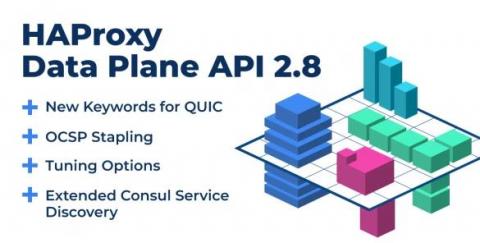
We are proud to announce that we have released HAProxy Data Plane API 2.8, available on our GitHub page. This release follows the recent HAProxy 2.8 release and incorporates its changes, along with some improvements and changes specific to the API. HAProxy Data Plane API 2.8 adds new keywords focused on QUIC, OCSP stapling, and tuning options that allow you to customize your HAProxy process using the HTTP REST API programmatically.
Are you interested to learn about the characteristics of Elasticsearch for vector search and what the design looks like? As always, design decisions come with pros and cons. This blog aims to break down how we chose to build vector search in Elasticsearch.
I’m excited to announce The Forrester Wave™: Process-Centric AI For IT Operations (AIOps), Q2 2023 named ServiceNow as a Leader among the top vendors in the crowded AIOps market.1 Our journey to this position underscores our leadership in predictive AIOps. We’ve continuously harnessed the immense potential of AI to enhance operational efficiencies, drive productivity, and revolutionize user experiences.
Cloud monitoring tools are utilized to gather an extensive range of metrics and logs from cloud resources and services. Some commonly monitored metrics include CPU utilization, memory usage, network traffic, disk I/O, latency, and response time. By monitoring these metrics, among others, it becomes possible to gain insights into resource utilization, identify performance bottlenecks, and ensure that the infrastructure operates according to expectations.
The eCommerce businesses have expanded in leaps and bounds during the COVID-19 and post-COVID situations and continue to show the same trend. People across the globe continue to shop online for their needs of clothing and apparel, home needs of groceries, home appliances, home décor, health and fitness products, sports needs, automotive accessories, jewelry, and much more. Today’s modern-day customers prefer to purchase online many of their needs with a single click through their mobiles.