Operations | Monitoring | ITSM | DevOps | Cloud

Sponsored Post

The 29 best DevOps tools for 2023 and beyond

The integration of Development and Operations is a powerful innovation in how we build software. If you're new to DevOps practices, or looking to improve your current processes, it can be tough to know which tool is best for your team. We've put together this list to help you make an informed decision on which tools should be part of your stack. Read on to discover the 29 best DevOps tools, from automated build tools to application performance monitoring platforms.

Featured Post

After action reports: post-incident investigations

When something unexpected happens within the digital operations remit, software engineers put on their deerstalker hats and wax their fussy little moustaches-metaphorically. It's their time to play detective as they unravel the evidence and create the reports to explain the recent IT incident. But unlike with a hat-wearing Sherlock Holmes or a hirsute Hercule Poirot, cliff-hanger endings are not encouraged in software engineering.

API update: User invitations

Today, we’re excited to share the latest endpoint release for the Raygun API, user invitations. With this release, customers can now use the API to automate the process of inviting new team members to Raygun. With unlimited seats included in every Raygun account, one of the best ways to get the most out of Raygun is to add more team members to your plan.

Easily monitor Docker Desktop containers with Grafana Cloud

18 million — that’s the number of developers around the world who use Docker, the popular tool for containerization. Docker Desktop, a software application for Mac, Windows, and Linux, is one of the most widely used tools within the Docker ecosystem, especially among developers who want to build, test, and deploy applications in containers on their local machines.

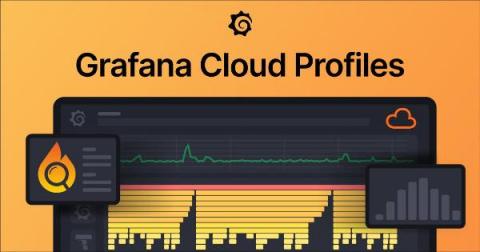
Continuous profiling now in public preview in Grafana Cloud

When we announced that Pyroscope was joining Grafana Labs back in March, we expressed our excitement that uniting the Pyroscope and Phlare open source projects and teams would accelerate our plan to add continuous profiling to Grafana Cloud. Just two and a half months later, that day has come! We are proud to announce that Grafana Cloud Profiles is now available in public preview for all Grafana Cloud users, both paid and free.

IPL: How to use ipl-validator

In my last blogpost I explained how our ipl-html lib works and how to use it. With the help of ipl-html it is possible to add forms. Usually we want to validate the data of the form before submitting it and display messages if the validation fails. For this purpose, we have introduced the ipl-validator. The ipl-validator includes many useful validators, and today I want to explain how you can easily use them.

Install Graphite: Common Issues

Graphite is a very popular enterprise monitoring tool. This article will address the common issues that occur while setting up a Graphite instance, and how they can be avoided. We will assume readers have already become acquainted with Graphite, but if you’re interested to learn about the basics of Graphite, check out our articles on the Architecture and Concepts of Graphite and the Installation and Setup before reading this article.

Open Source Monitoring vs Proprietary Software

It’s easy to get pulled into paying more and more at a major monitoring company, despite not getting the functionality that you’re looking for. Leaving your monitoring provider can be difficult because it means replacing expensive software or hardware, re-educating your team, and transferring huge amounts of data to a new system - data that may or may not be well suited to the new system. Despite these issues, there are many reasons that motivate users to move to open source.