Operations | Monitoring | ITSM | DevOps | Cloud

The latest News and Information on Monitoring for Websites, Applications, APIs, Infrastructure, and other technologies.

What Is Website Monitoring?

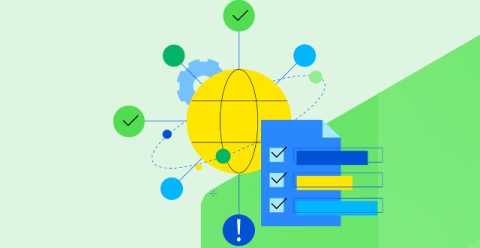
Website monitoring is the process of tracking a website's key performance indicators using a set of tools and best practices. The goal is to maintain consistent availability and a good user experience, even during unexpected traffic spikes. A slow or poorly performing website can frustrate users, disrupt their online journey, and negatively impact the bottom line. Website monitoring helps organizations avoid downtime and proactively respond to potential errors before they affect the end-user experience.

Infrastructure Monitoring Basics: Getting Started with Telegraf, InfluxDB, and Grafana

Ensuring the reliability and performance of applications and systems is vital to a healthy infrastructure. With the exponential growth of data, traditional monitoring approaches fall short of providing real-time insights and proactive problem-solving. That’s where InfluxDB comes into play, offering a robust and scalable solution for all your monitoring needs.

Mastering Microsoft Teams Network Assessments: How to Audit Microsoft Teams Performance

Microsoft Teams has become a cornerstone of collaboration and communication for countless enterprises worldwide. However, as reliance on Unified Communications (UC) grows, so do the chances of encountering performance issues. While Microsoft Teams offers some native tools for network assessments, they often prove limited and fail to address underlying issues effectively.

Cribl Search Now Supports Email Alerts For Your Critical Notifications!

Cribl Search helps find and access data regardless of the format it’s in or where it lives. Search provides a federated solution that reaches into existing object stores and explores data without moving it or having to index it first. This same interface can also connect to APIs, databases, or existing tooling, and can even join results from all these disparate datasets and display them in comprehensive dashboards.

Open Source vs. Closed Source Software

In software development, two primary models of software exist: open source and closed source. Both types have their benefits and drawbacks, and understanding the differences between them can help you make informed decisions when choosing software for your projects. To simplify the concepts of open source and closed source software, let’s use the analogy of community cookbooks — open source — and a secret family recipe: the closed source.

What is OpenTelemetry? The Definitive Guide to Modern Observability

Imagine having total awareness of your apps: observing the effects of code on efficiency, identifying bottlenecks, and predicting crashes. The open-source observability platform OpenTelemetry makes this possible. OpenTelemetry, designed to collect telemetry data, provides you with the knowledge necessary to enhance your systems and provide a flawless user experience.

Legacy alerting removal: What you need to know about upgrading to Grafana Alerting

Two years ago, when we launched Grafana 9, we announced the deprecation of legacy alerting and introduced Grafana Alerting, the new default alerting system in all editions of Grafana. Since then we have invested in Grafana Alerting, making it easier to create and manage your alerts. Along the way we have also worked to make the transition from legacy alerting to Grafana Alerting as seamless as possible in preparation for the time when we remove legacy alerting altogether from Grafana.