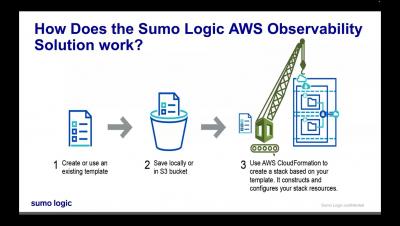
Adding a Service to AWS
Join an Observability expert and Sumo Logic's Technical Account Manager Ramneet Malhotra as she demonstrates that adding Amazon SQS to the Cloud Formation template and Explore Dashboard panels is pretty painless.


The latest News and Information on Monitoring for Websites, Applications, APIs, Infrastructure, and other technologies.
What is an observability engineer? Is it your SIEM admin? How about your application performance monitoring admin? Neither? Both? Observability engineering is more than administering a tool. There is more to it than data onboarding, writing parsers, and getting data in. As an observability tool admin, you work with data producers and consumers to get data in a human-readable and searchable format from the source to the analytics system.
Flux is InfluxDB’s functional data scripting language. It’s made to query, process, analyze, and act on data. It’s very powerful and is built and optimized for time series. There are so many things you can do with Flux it can be hard to know where to start. This August, InfluxDB University launched a free Intermediate Flux course taught by experts that can take your Flux skills up a notch.
This fall Amazon Prime Video became the exclusive broadcaster of the NFL’s Thursday Night Football. This move continued Prime Video’s push into the lucrative world of live sports broadcasting. While they had previously aired TNF, as it is known, this is the first season Amazon Prime Video has exclusive rights to broadcast these games. As you can imagine, airing these games has led to a surge in traffic for this OTT service.
Observability is a very important aspect of software that’s often taken for granted. You need to have visibility into what your application is doing at different levels to better understand an issue when it occurs. There are multiple open-source tools and initiatives to help you achieve improved visibility. When we talk about observability, there are three parts to consider: logs, traces and metrics.
Digital transformation requires organizational evolution. Constant demand for rapid delivery of upgrades and new products forces change. Surely, the old days of managing monolithic applications housed in private servers are over. Applications consist of virtualized, containerized, and serverless code that’s networked via APIs across a hybrid infrastructure of public and private clouds.
HashiCorp Consul began as an open-source project for service discovery. It has evolved to provide other valuable functionality like secure service mesh to help secure microservice architectures based on service identity, but also the ability to achieve repeatable application deployment lifecycles via Network Infrastructure Automation and control access to the service mesh via Consul API Gateway.These features are considered the four core pillars of Consul service networking.
We’ve just released a new feature! Presenting Public Dashboards. It is one of the most requested features in the last 6 months. People wanted to have an easy way to share the dashboard with their team and customers. Now it’s possible! And the best news is that it is accessible to every plan.