The latest News and Information on Monitoring for Websites, Applications, APIs, Infrastructure, and other technologies.
Brand loyalty might be on the decline, but ecommerce is on the rise. Ecommerce is on track to account for 24% of global retail sales by the end of 2026. Source: Statista And as businesses reach growth limits in their local markets, the industry is seeing more ecommerce brands expanding onto the global stage. 76% of online shoppers have made purchases on sites outside of their own countries.
For many organizations, making the most of the visibility Datadog offers into the health and performance of their infrastructure means displaying dashboards to stakeholders in various settings continuously and in real time. But the standard solutions for sharing dashboards to large-format displays can be onerous, involving sundry software and hardware and restrictive manual setups. These solutions can also pose significant security risks, since they tend to involve sharing passwords or devices.
Asynchronous communication between various CX applications has long been made possible by enterprise messaging solutions like IBM MQ and – more recently – Apache Kafka. Developers might assume that these two technologies are interchangeable. However, once they scrape the surface, critical differences between IBM MQ and Apache Kafka come to light.
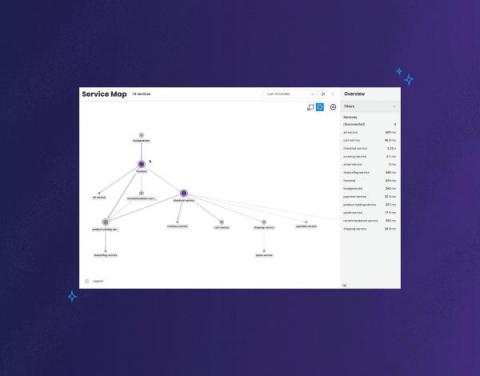
Today, we're announcing the launch of Honeycomb Service Map. This isn't your grandparent's version of a service map. This feature reimagines what it is that you want to know or investigate when looking at visualizations of how your services communicate with one another.
HAProxy is generally the frontend layer of your application, which means it plays a critical role since all traffic first lands on this layer. Because of this, you need to make sure everything is working at this layer all the time, as any issue can directly impact your business. Therefore, having visibility on this layer is crucial. Visibility can come from two aspects: the metrics HAProxy emits and the logs it generates while handling requests.
If you’re finding it a little difficult to sift through all the varying, often conflicting information surrounding the topic of network observability, you’re certainly not alone.
When you design architecture to monitor your digital assets - either software applications or hardware devices, you need to use different strategies depending on your monitoring target. The factors you want to consider can vary including methods of retrieving monitoring data, frequency of data collection, and how you want to surface metrics and insight you find to stakeholders. In this article, we will mainly discuss how we can monitor your network SNMP devices using Hosted Graphite.