The latest News and Information on Monitoring for Websites, Applications, APIs, Infrastructure, and other technologies.
For much of the past two years, businesses have been looking ahead to an eventual return to the office – a return that has been frequently delayed and disrupted by the unpredictable nature of the COVID-19 pandemic. But with some employees resistant to returning, companies are looking for new options to entice employees back. It may not be a return to the office at all, but instead a movement towards an entirely new way of working together.
We’re thrilled to announce several new observability features for the Pub/Sub to Splunk Dataflow template to help operators keep a tab on their streaming pipeline performance. Splunk Enterprise and Splunk Cloud customers use the Splunk Dataflow template to reliably export Google Cloud logs for in-depth analytics for security, IT or business use cases.
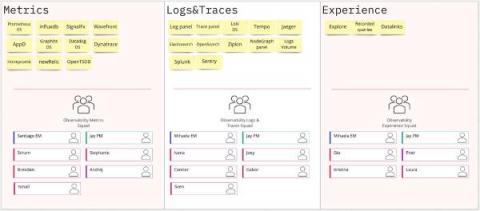
Over the past year, Grafana Labs has grown from 300 to 700 Grafanistas. Moving forward, we expect to continue to maintain a high rate of change, and to sustain that, we need to ensure there is flexibility in how our teams* are set up. The majority of our Engineering squads have changed in size and structure — and the same goes for the Grafana Observability team, where I work.
Many software developers utilize Node.js to create high-performance backend web applications. It has numerous advantages, including ease of application deployment, asynchronous request handling, great performance, and more. Integrating a solid monitoring solution into your Node.js application is critical since it gives you visibility into what's going on in your application at any given time or over a specific time.