Operations | Monitoring | ITSM | DevOps | Cloud

The latest News and Information on Monitoring for Websites, Applications, APIs, Infrastructure, and other technologies.

Dash 2021 Keynote

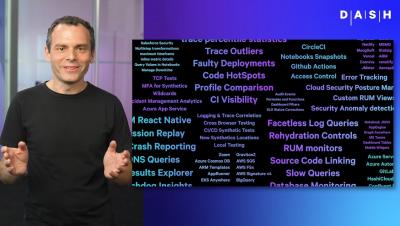
The Datadog team deliver the annual Dash keynote. At Dash 2021, we announced new products and features that give your team even greater visibility into the health and performance of your code, databases, CI/CD pipelines, and more. Now, you can monitor network devices, get visibility into your services' golden signal metrics without touching a single line of code, and integrate third-party tools into our platform with Datadog Apps. We expanded RUM to include iOS error tracking, Session Replay, and Watchdog Insights. And we introduced Datadog Observability Pipelines, which run on your infrastructure and put you in control of your observability data, from how it’s processed to where it’s sent.

Panel: Improving Monitoring & Reliability with Chaos Engineering - Dash 2021 (Datadog,Gremlin,Pismo)

Monitoring and observability are critical for knowing how your systems are behaving, but how do you create the feedback loops to shift from reactive monitoring for incidents to proactively preventing them? In this roundtable discussion Mauricio Galdieri, Software Architect at Pismo.io and Kolton Andrus, CEO and co-founder of Gremlin join Tay Nishimura, Site Reliability Engineer on the Chaos Engineering team at Datadog to chat about monitoring, Chaos Engineering, and using them together to build more reliable systems.

Scaling HashiCorp's Cloud Platform - Dash 2021 (HashiCorp)

Identifying bottlenecks during times of high load is critical to building a scalable software platform. Stress testing is one way to simulate high load on a system and allows you to proactively capture potential bottlenecks before they impact customers. Once a solution is implemented to address the bottleneck, you need a way to measure success and find a new limit. See how HashiCorp Cloud Platform (HCP) has developed a stress testing framework which heavily relies on Datadog’s custom metric capabilities in combination with some out of the box integrations to give HCP engineers a comprehensive view of their platform and how they used these insights to scale their concurrent data-plane provisioning by 300%.

Panel: Handling Incident Response - Dash 2021 (Datadog, PagerDuty)

When customer-impacting downtime happens, it’s crucial that responders are prepared and can resolve these issues as quickly as possible. Knowing the right tools to use, from wherever you are working from, will help to have a well-defined strategy in place to come together as a team, work the problem, and get to a solution quickly. In this roundtable discussion, PagerDuty and Datadog engineers chat about incident responses and how we use all the tools at our disposal to respond quickly and effectively.

Roundtable: The Complexities of Cloud Migration - Dash 2021 (Datadog, LaunchDarkly, StockX)

Often when completing a migration project, you’re having your organisation straddle between two systems. You’re fighting habits and changing attitudes while also attempting to complete a high-risk operation. Every software team at one stage in their career will have to complete a migration. Whether it’s to improve scalability and performance, or transition between an on-prem to cloud solution, you’ll need a deep understanding of your current environment to create a strategy that minimises downtime for your team.

How to do serverless monitoring right #shorts

Monitoring CPU load and memory usage is common practice, but with serverless no action is required. In this video, we quickly explain that if your Cloud Run instances start hitting high CPU load, Google Cloud will automatically spin up new instances for you, and vice versa!

"Open source done right": Why Canonical adopted Grafana, Loki, and Grafana Agent for their new stack

Michele Mancioppi is a product manager at Canonical with responsibility for observability and Java. He is the architect of the new system of Charmed Operators for observability known as LMA2. Jon Seager is an engineering director at Canonical with responsibility for Juju, the Charmed Operator Framework, and a number of Charmed Operator development teams which operate across different software flavors including observability, data platform, MLOps, identity, and more.

How Pingdom's Real User Monitoring Can Help Optimize Your WordPress Website

Enterprise web applications or medium-to-large, consumer-facing websites are typically built by teams of engineers, administrators, web developers, and other professionals. However, once a site goes live, the operations team is responsible for keeping the site up and running at optimal performance. Online users aren’t forgiving, often abandoning a site as soon as they encounter an issue with functionality, complexity, or performance.

Working With the WordPress REST API

Logging is an important part of every software application. In addition to capturing user activity, well-structured logs can make it easier to debug problems should they occur. But if your application is split up across several different subsystems, collecting and analyzing disparate logs can be a real challenge. Picture this scenario: You work at a startup that uses a CMS managed by a few admins. You also have a standalone front-end application for users to communicate with your platform via an API.