The latest News and Information on Monitoring for Websites, Applications, APIs, Infrastructure, and other technologies.
Now how many of you have better monitoring as part of your New Year’s resolution? You want to implement better monitoring into your Citrix environments, right?You want your end-users to experience less technical faults by having a system in place that allows you and the team to be more proactive. OK, probably not what you have been thinking as the clock struck midnight, but it should be part of your professional goals for 2020.
We’ve been told by the poets that the best things in life are free: A sunrise in spring, the scent of a flower, the coo of a baby, having a buddy who can get his hands on football tickets. It’s all so beautiful and uplifting (especially the football tickets). But at the same time, the economists remind us that there’s no such thing as a free lunch. And of course, we know from experience that this is often the case.
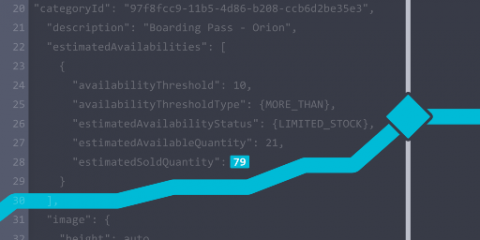
Imagine that your API response includes data that you would like to track and get regular reports on, and you may even want to generate alerts when values hit certain thresholds. You’re already monitoring for API performance and function, but how about grabbing the other data at the same time. Wouldn’t it be nice to capture the data, evaluate it, and store it in your Uptrends account? You can with Uptrends’ newest Multi-Step API feature, Custom Metrics.
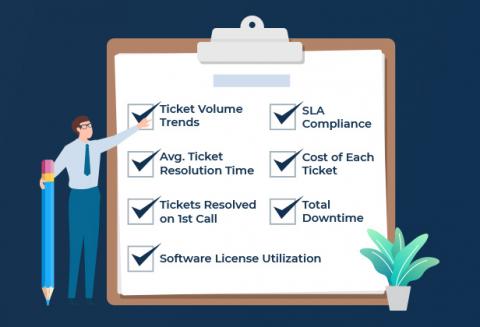
Service desk or IT teams are critical to organisations for ensuring business continuity and service delivery. Hence, it becomes important for IT organizations to use a slew of metrics to measure how efficient their service desk is. With the recent advancement in IT Service Management (ITSM), the reporting capabilities offer multiple KPI metrics that can be measured and monitored. So, with the increase in service desk metrics, it becomes even more difficult to zero down on which metrics to measure.
Meet Stackdriver Logging, a gregarious individual who loves large-scale data and is openly friendly to structured and unstructured data alike. Although they grew up at Google, Stackdriver Logging welcomes data from any cloud or even on-prem. Logging has many close friends, including Monitoring, BigQuery, Pub/Sub, Cloud Storage and all the other Google Cloud services that integrate with them. However, recently, they are looking for a deeper relationship to find insight.
It’s Friday, and a holiday (of sorts) heading into a long weekend (for some). We’re going to start with something light, and then get a little heavier. If you like what you read here, please do share with your colleagues and pals! Share the love...of work. You may not care for the Hallmark holiday of Valentine’s Day, but why not celebrate all sorts of love on this day? Let’s start with work, where great things can happen with the right attitude.
Datadog operates large-scale Kubernetes clusters in production across multiple clouds. Along the way, audit logs have been extremely helpful for tracking user interactions with the API server, debugging issues, and getting clarity into our workloads. In this post, we’ll show you how to leverage the power of Kubernetes audit logs to get deep insight into your clusters.