Operations | Monitoring | ITSM | DevOps | Cloud

The latest News and Information on Monitoring for Websites, Applications, APIs, Infrastructure, and other technologies.

Essential Open Source Serverless Code Libraries

Serverless applications, due to their distributed nature, are often stuck having to reinvent the wheel. While small utility scripts and functions are often easily instrumented and monitored, anything of a transactional nature will need to implement special code to provide developers with common tools like stack traces, atomicity, and other patterns that rely on a singular flow of control.


How Can I Check My ElastAlert Rule is Configured Correctly?

Making sure that your ElastAlert yaml file is formatted and configured correctly. All of the below points will prevent alerts from being fired but there may not be an error message associated with the problem. It is possible you may need to contact support to investigate this issue for you. Make sure to proof read the rule you have written to ensure that it is what you expect to see as most of the issues regarding ElastAlert not working correctly is related to the points above.

Think You're a Proactive MSP? Think Again!

MSPs generate more MRR (monthly recurring revenue) when they’re able to reduce reactive noise and dedicate their resources to more proactive MSP tasks. This is because proactive tasks are predictable. They’re scheduled into our days (e.g., regular technology alignment visits, business impact and strategy meetings, centralized services, and projects). We know how much they cost and how long they take to complete. We know the margins on proactive tasks (if we price them properly).

Scale-Up vs. Scale-Out Storage: Tips to Consider

In the Data Age 2025 report, worldwide data is expected to grow 61% to 175 zettabytes by 2025. The enterprise sector, in particular, generates more than 30% each year. To be ready for a digital future, consider the scaling strategy of data infrastructure beforehand. Scale-up and scale-out are the main ways to add capacity to your infrastructure.

"4:00 in the Morning" - Managing a VDI Migration

For all its benefits, Virtualization Desktop Infrastructure (VDI) continues to be a massive headache for many enterprise technology teams. From improper personas and sizing, long logon times, hangs, lost sessions, freezes and crashes—often one small mistake in a virtualized environment can set your entire enterprise ablaze.

Chaos engineering + monitoring, part 2: for starters

Oh man, did I get ahead of myself in my last post! I started chatting tools, and I realize now that I really should have been talking more about why I’m using Sensu and Gremlin. But it didn’t occur to me until last year at Monitorama. John Allspaw gave the keynote talk (Taking Human Performance Seriously). While you can watch the talk here, I’ll highlight a few points...

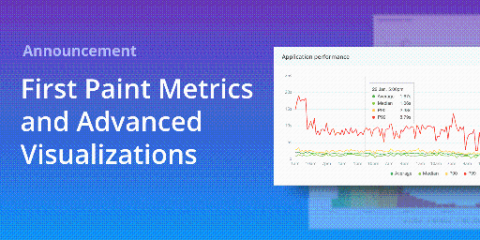
Announcing: First Paint Metrics and Advanced Visualizations

Since Real User Monitoring first launched in 2015, Raygun has helped thousands of teams identify and resolve front-end performance bottlenecks impacting their customers. Today, we’re excited to announce support for first paint and first contentful paint, along with rich new visualizations designed to help you better identify and diagnose performance problems in your software.

Azure Monitor (Part 2): Azure Monitor Logs-Getting Started

In our previous post, we discussed the question: 'What is Azure Monitor and how does it work?' and also covered the two types of data it stores, at a high level. In this part, we will get ourselves started with Azure Monitor Logs. More specifically, we'll discuss how Logs are collected by Azure Monitor or, in other words, what options you have to add data sources to Azure Monitor so you can display that data in a way that makes sense to you.

SolarWinds Server Configuration Monitor Overview

SolarWinds Server Configuration Monitor (SCM) is designed to provide insights into Windows® server and application changes to help you pinpoint the root cause of performance problems faster. Detect, track, and receive alerts when changes occur, allowing you to correlate system performance against configuration changes, know who made changes, and compare configurations over time. SCM integrates with SolarWinds Server & Application Monitor, allowing you to extend troubleshooting of system and application performance from one unified console.